
To successfully run any business or service, it is very important to understand the preferences of customers and their activities. In today’s era of digital marketing, Google Analytics 4 (GA4) is one of the best tools to track this user activity. But when it comes to proper data analysis, we often face a big problem.
For the needs of a website or business, we constantly have to make various technical updates or run new marketing campaigns. Due to the impact of these tasks, user activity on the site can suddenly increase a lot, and sometimes due to technical errors, the data can even drop to zero.
The problem becomes apparent when we go to create yearly analyses or long-term reports. It becomes almost impossible for us to remember exactly why this unusual change in the data occurred a few months ago (for example, a specific campaign, site maintenance, or special offer). As a result, it becomes difficult to give a correct interpretation of the data.
Almost all of us who work with data have faced this same problem. Especially when we have to do long-term reports or long-term analysis, it becomes almost impossible to remember exactly when a marketing campaign was run or when a major technical update was made to the site.
As a result, when we see an unusual change in data from the last six months or a year ago, we are confused – was it due to our success or the result of a technical error?
Have you ever wondered what it would be like if you could write small notes inside the graphs of the report?
The good news for you is that GA4 (Google Analytics 4) has done just this for us. This wonderful feature is called “Annotations.”
Annotations
So, the GA4 annotations act as a “digital diary” or “notebook” for you. Here are its main functions:
Let’s say you started a new Facebook ad campaign today or made a major change to your website. If you go to “Annotations” and write a note, then in the future when you see the ups and downs of the data on the graph, you will easily understand why that change occurred.
Or if you work with a team instead of working alone, these notes can also be seen by other members of your team. For example: “There was a problem with the server on the 10th, so traffic was low.” If you write this down, you will not have to ask someone else separately when they see the report.
If you use the Annotations feature in your GA4 property regularly, it will act as a powerful digital note for your reporting. As a result, you will no longer have to go through the hassle of checking old record sheets or separate documents. All your necessary information will be in your analytics dashboard.
Digital marketing or data analysis is usually a teamwork. When another member of your team looks at that report in your absence or in the future, these notes will act as a guide for them.
Without annotations, your team member or client may be confused or worried when they see a sudden big change in the data (why did it happen?). But if there is a small note there, they will understand the real reason in an instant. This will not only save time, but also maintain professionalism and transparency of the work.
Setup GA4 Annotations
How to set up GA4 annotations? (Step-by-Step Guide). This new feature in GA4 is very easy to find and use. Below are the steps:
First, log in to your GA4 property and click on the Admin option in the lower left corner.
If you scroll down a little from the Settings menu, you will see a drop-down section called “Data display.” This basically controls how the data in your report will be displayed.
Inside this data display section, you will find the much-awaited “Annotations” option.
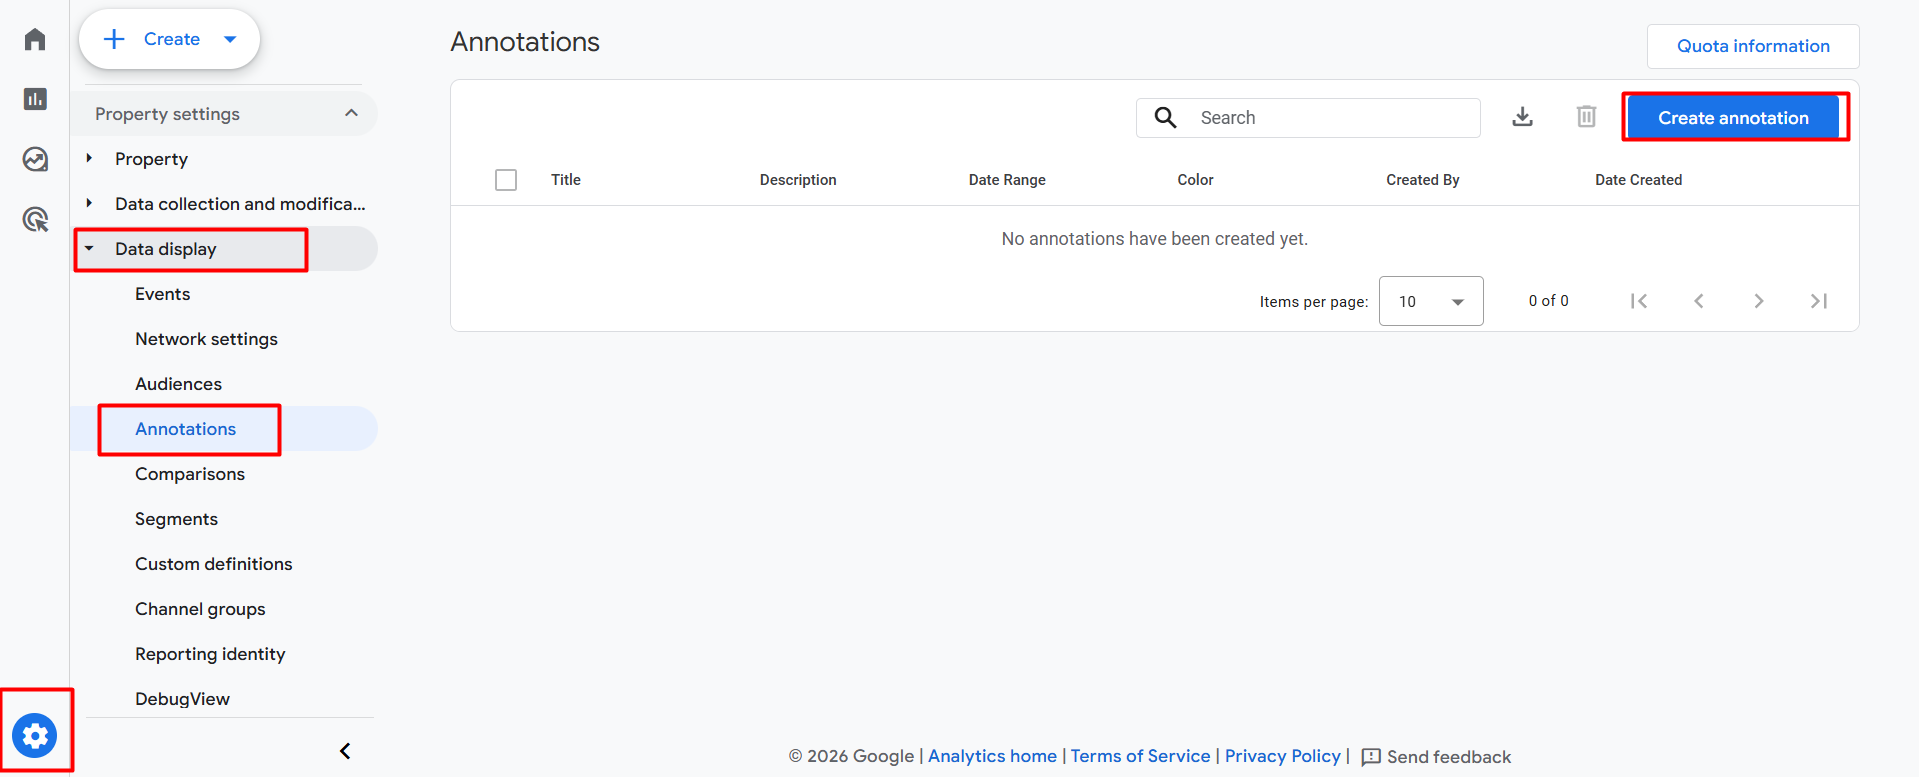
Clicking there will give you the “Create annotation” button.
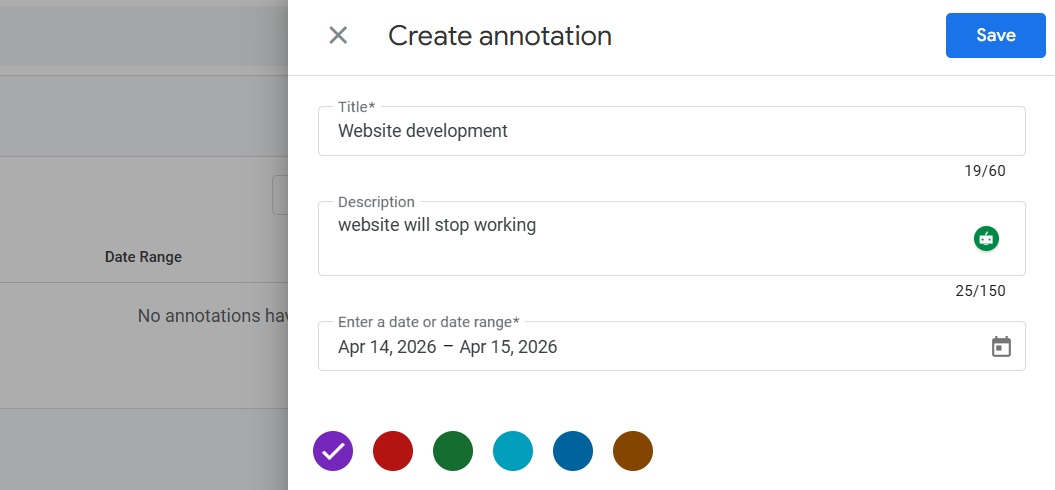
Here in GA4 annotation creation section
When you produce a new reflection in GA4, this is how to fill out the interface that comes before you impeccably.
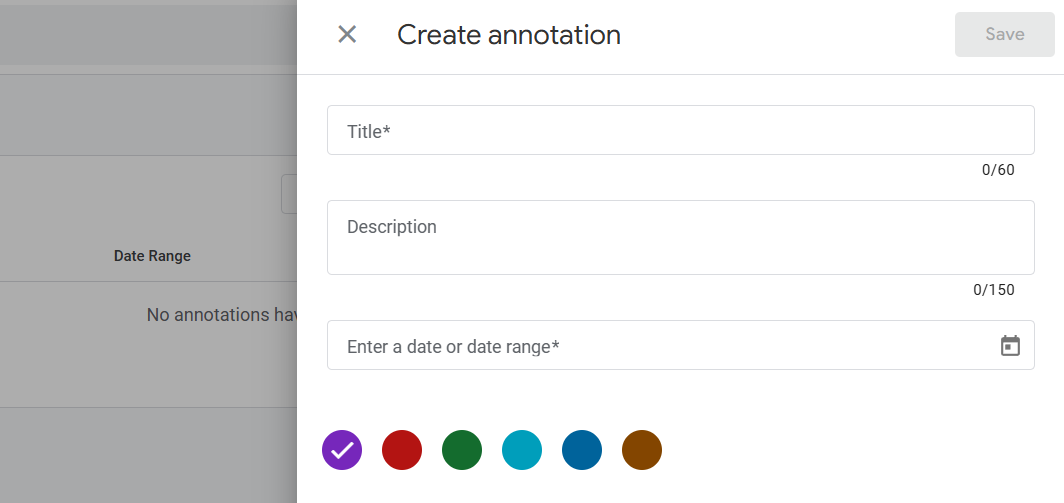
- Title Epitomize the main point At the top of the interface is the ‘Title’ box. Then you need to give a meaningful name to the note. For illustration, in the screenshot, it’s written “website development.” This principally works as a caption. When you hang your mouse over your overview graph or report in the future, this title will be the first thing that pops up. So the title should be similar enough that it’s clear in an alternate what actually happened that day.
- Here in the description write down the reason behind Below the title is the ‘Description’ box. This is a detailed tablet for you. Then you can write down the depth of the incident or specific reasons. For illustration, in the screenshot, it’s written, “The website will stop working.” During long-term analysis (e.g., after 6 months or 1 time), this description will remind you exactly why business dropped or transformations were introduced.
- With date range accurate time tracking It’s veritably important to clarify how long an event has had an impact. You can select specific dates in the ‘Enter a date or date range’ box. However, 2026 – Apr 15, 2026, shown in the screenshot, if a particular crusade or specialized task lasts longer than one day (similar to Apr 14). This will ensure that your note will be visible only in that specific part of the graph.
- Color Selection Using different colors for different types of notes is a great strategy. You can choose the color of your choice from the color palette at the bottom of the interface.
- Save: After filling in all the fields rightly, click the ‘Save’ button.
GA4 Annotations check
Congratulations! You have successfully completed your GA4 Annotations setup. Now the question is, how do you view these notes in your main report? The process of viewing it is also very simple.
To view your notes, first click on the ‘Reports’ section from the left menu of the GA4 dashboard. Then open any report as per your requirement.
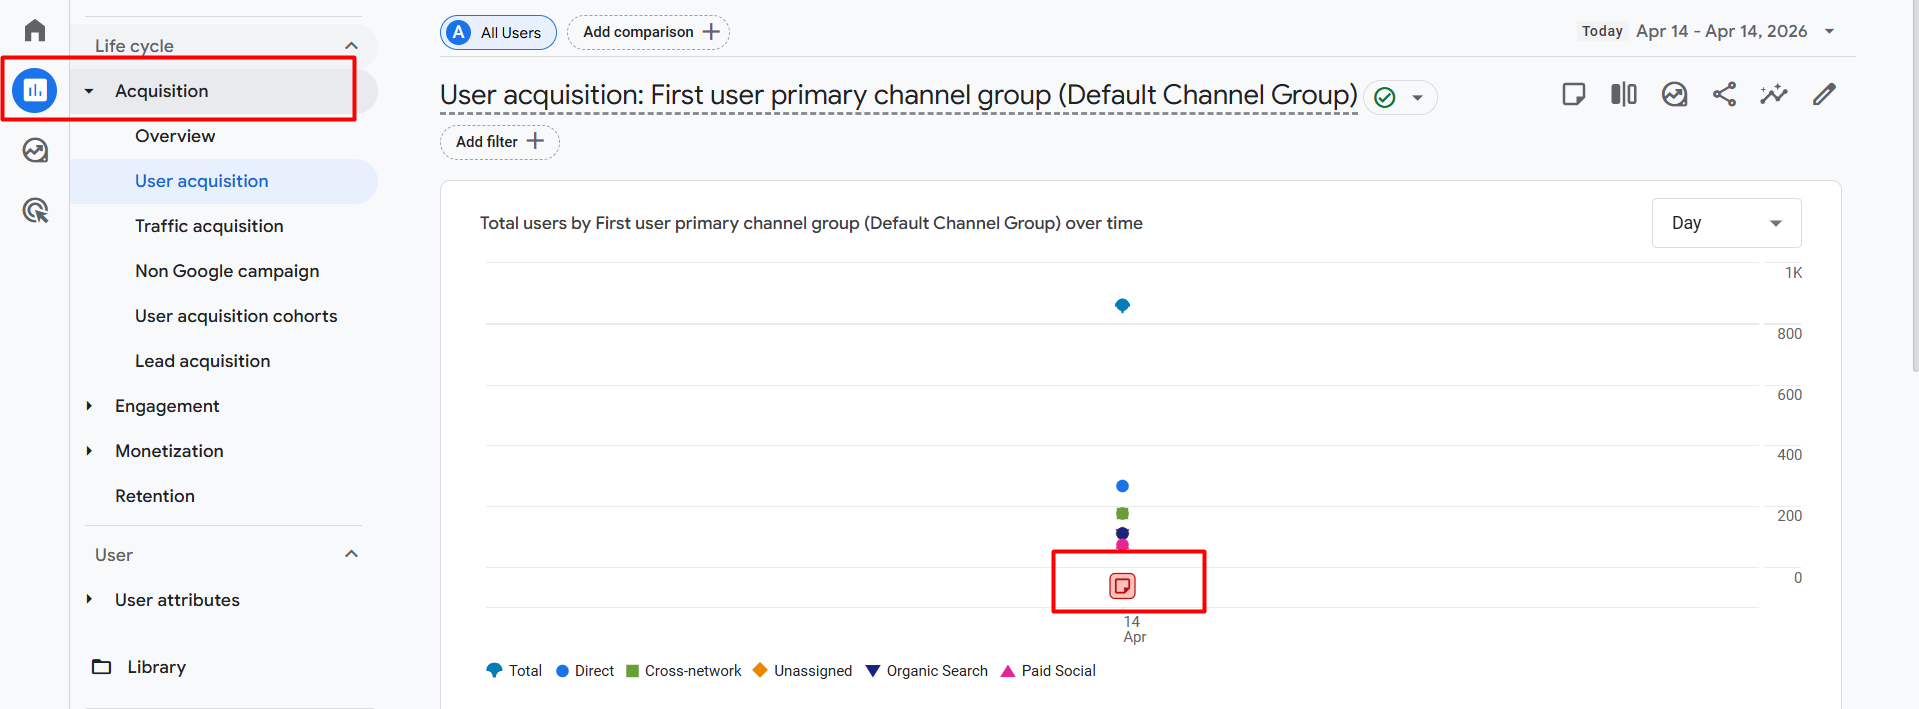
After everything is set up, you can easily understand how your created note will appear in the report by looking at the screenshot above.
Notice at the bottom of the screenshot, I have highlighted it with a red box (red mark). The small icon that appears just below the graph is the annotation we created.
Whenever you hover your mouse over this icon (i.e., place the mouse cursor). The title and description you gave will appear in a small pop-up box.
From now on, whenever you notice any unusual changes or differences in your report data, you will no longer have to worry. With this annotation feature. You can easily and quickly find out exactly what caused this difference in the data.
As a result, you will not have to run to your team members repeatedly or ask, “What happened on such and such date?” The data in your report will now speak to you.
If you notice in the screenshot. You will see that I have selected the color red for my notes. However, you can choose any color according to your needs or preferences. Using different colors for different types of events (for example, red for technical issues and blue for marketing campaigns) will make your report look more organized and professional.
Finally
Data is not just numbers. It is a reflection of every small and big step of your business. By using GA4 annotations, you are not only making your data analysis easier. But also making it more meaningful and accurate. From now on, you will not have to be confused if you see any unusual changes in the data in your reports. Your own notes will tell you the right information.
So start noting your important events today and take your reporting to a new level!