
We are currently going through a series of articles on GA4 (Google Analytics 4). We are starting by connecting websites and then going step by step into data analysis. So if you are new on this platform, then don’t forget to check our other article.
In today’s article, we will talk about GA4 filters and comparison features that will improve and perfect your data analysis experience. Using these settings, we will discuss in detail how you can better filter your website data and compare it between different audiences.
Table Search Filter In GA4
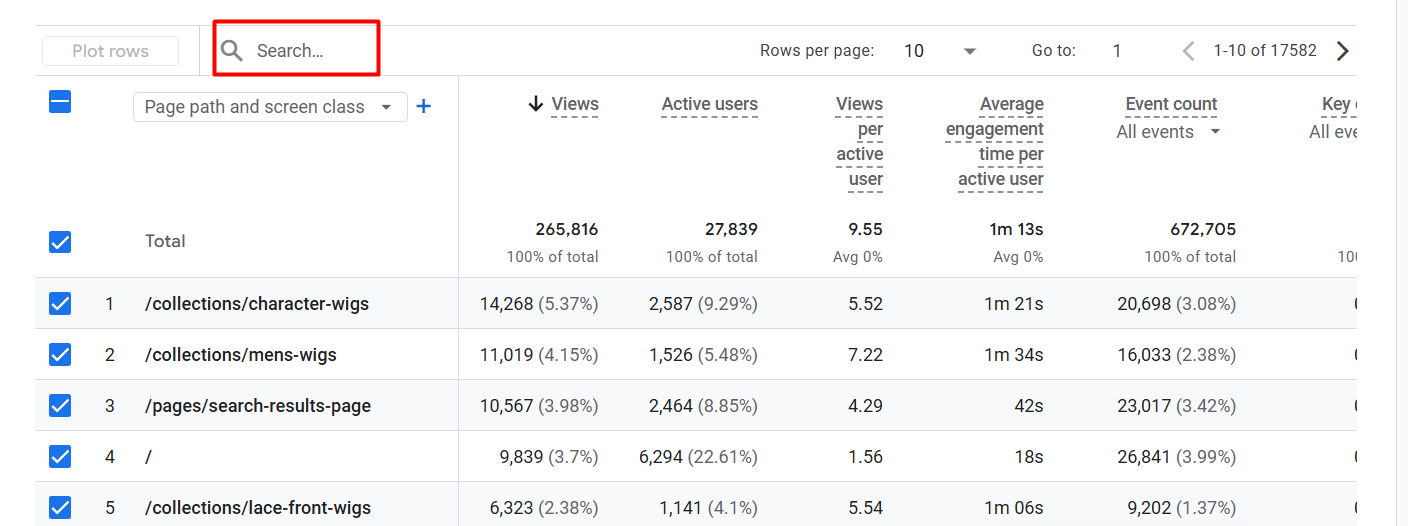
So, let’s start with the very basics from the “GA4 filters and comparison” article. First, we will get acquainted with the basic filter (Table Search Filter) option of GA4.
This filter works like magic to find a specific page or content from the huge data table of your report. You can easily find your desired data by using the ‘Search’ bar marked in the red box in the image above. Using this will greatly increase the speed of finding your specific target or information and save your valuable time.
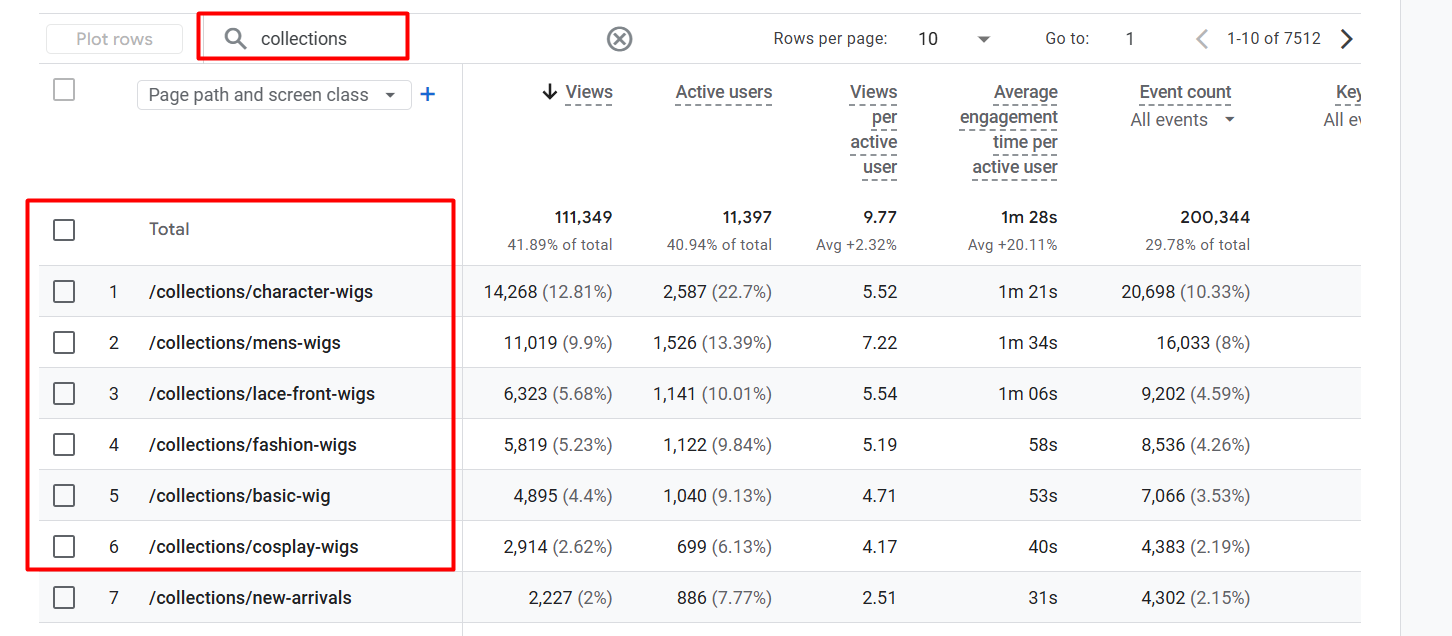
If you look at the image above, you will see that we have searched for “collections” in the search bar. As a result, we immediately got data only for those pages that have the word “collections” in their link or URL.
If your website is very large and has hundreds of pages, then this filter will work as a life-saver for you. With this filter, you can easily find your targeted pages and check their performance separately. This is basically the easiest way to isolate the part you need from the mountain of data.
Advance filter In GA4
The basic or table search filter we’ve seen so far is excellent for quickly finding a page. But when you need to find answers to more in-depth and specific questions—like, “What are mobile users from the USA only doing on my website?”—that’s not possible with a simple search.
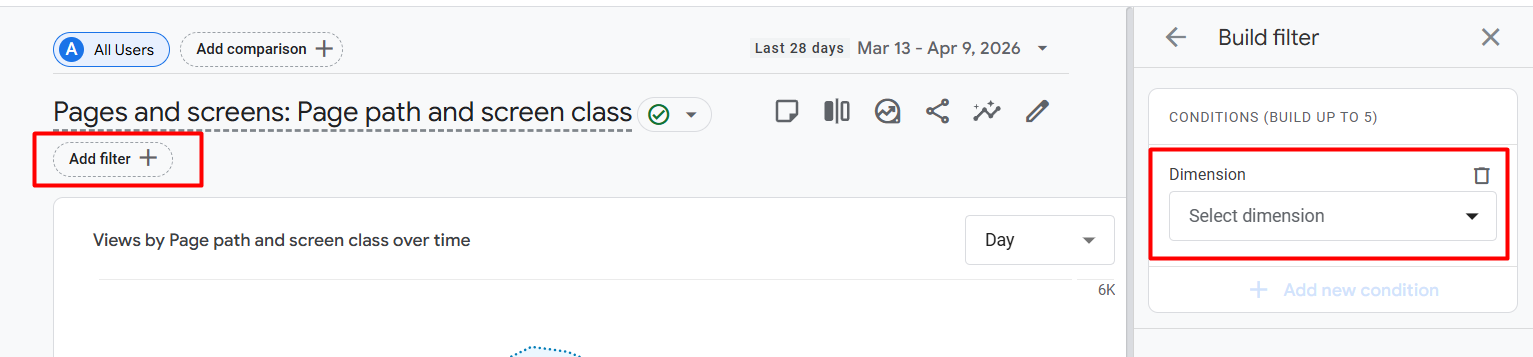
To overcome this limitation of a simple search and analyze the data more finely, GA4 has given us this ‘Add Filter +’ or advanced filter option. It basically removes unnecessary parts from the entire dataset of your report and allows you to zoom in on just the part you want. Through this, you can filter the data very precisely using the following categories:
- Demographics: View data based on users’ age, gender, or interests.
- Ecommerce: Filter by specific product purchases or transactions.
- Event: View data based on only those who have completed a specific event (such as a button click or form fill-up).
- Geography: Find visitors based on a specific country, city, or region.
- Page/Screen: Filter by specific page title or class.
- Platform/Device: Separate whether users are coming from mobile, desktop, or tablet.
- Time: Analyse by specific time of day or date.
- Traffic Source: Know exactly whether users are coming from Google search or Facebook.
- User: Separate new visitors versus returning visitors.
10. User Lifetime: Filter by how many times a user has visited your website or how much they have spent on your website in their lifetime.
Dimension
Before we dive into the advanced filters, we need to understand what a ‘dimension’ actually is. In simple terms, a dimension is a feature or category of data that is usually in text format (not numbers).
For example, when we say, “What country is the user from?” Here ‘Country’ is a dimension. Again, ‘What device is the user using? Here ‘device’ is a dimension. Basically, what you want to see the data on is the dimension.
All categories are dimensions in GA4 filters and comparison
Each option within the 10 categories you saw above (such as demographic, ecommerce, geography, etc.) is actually a dimension.
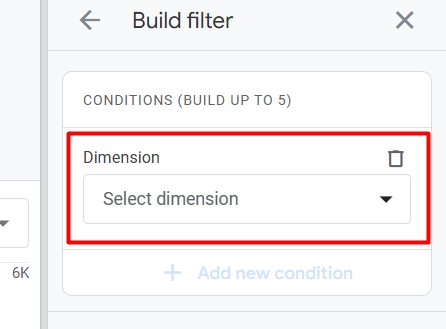
If you look at the image above, when creating an advanced filter, we are first asked to select a ‘dimension’. That is, you first decide on which feature you will filter on (such as city, browser, or page path). You can then filter your desired data by setting a specific value under that dimension.
Do the filter
A great example! In the screenshot, you can see a very nice practical filter setup. If you look at the screenshot above, you will see how this part of the advanced filter works. Here we have set a specific condition so that only the part we need is shown from the entire report data.
Let’s see what we have done here:
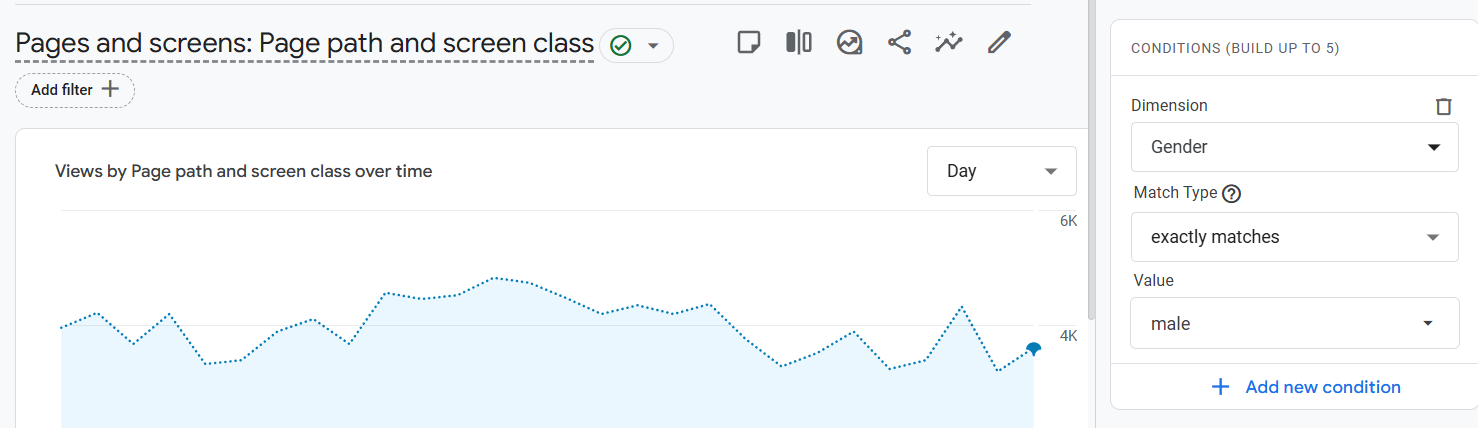
- Dimension: First, we have selected **’Gender’** as the dimension. That is, we want to see data based on the gender of the users.
- Match Type: Here we have used **’exactly matches’**. This means that we are telling Google that the exact data I am giving must match exactly. (There are many other options available here, like ‘contains’ or ‘does not match’).
- Value: Finally, we have selected **’male’** as the value.
**Result:** Once you apply this filter, your entire report’s graphs and tables will change. The views or user data you see in the report will only be for male visitors.
The biggest advantage of GA4’s advanced filters is that you can use not just one but multiple filters at once. Using the ‘AND’ logic and the ‘Add new condition’ button in the image above, we can take our analysis a few steps deeper.
Suppose
Your goal is to know, “How are all the visitors from the United States who came to your website through Facebook?” “How are they performing?”
In that case, as shown in the image:
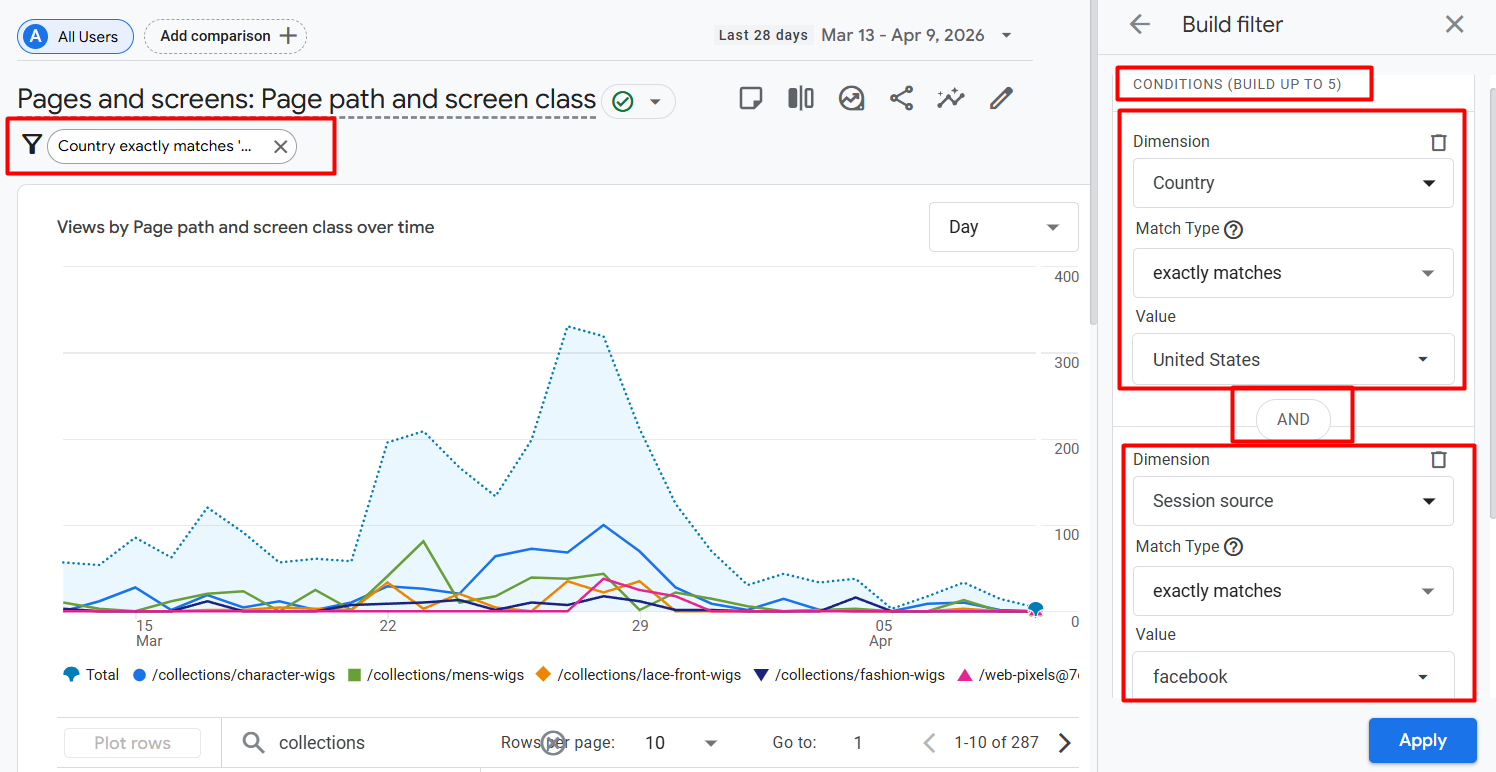
- First condition: ‘Country’ is selected as the dimension, the match type is “exactly matches” and ‘United States’ is the value.
- Logic: The ‘AND’ logic in the middle is working automatically, which means that both conditions must be true.
- Second condition: ‘Session source’ is selected as the dimension and ‘facebook’ as the value.
Result: Now only those specific data will appear in front of your report that have both come from America and Facebook referrals. If you look at the top left of the report, you will see the filter you set (Country exactly matches…).
In this way, you can add up to 5 conditions (BUILD UP TO 5) and track the behavior of your targeted audience with pinpoint accuracy.
This is how you can make your data analysis much more effective and meaningful by using the filter option. However, to take full advantage of this tool, you need to have a clear understanding of each dimension of GA4 at the beginning.
When you know what kind of data is under which dimension, it will be much easier to find your desired results or targeted audience. So, it is wise to take a look at all the dimension categories before going into the main analysis. This way, you will be able to extract the most important insights for your business more quickly and accurately.
Comparison In GA4
Comparisons is another great analysis method in GA4. It allows you to compare multiple datasets side-by-side. In simple terms, it helps you understand the differences between different audience segments.
The most interesting thing is that here you can compare not only devices or locations, but also **many other types of data** according to your business needs. For example:
Specific Page Performance: How do users from your “Offer Page” engage compared to users from your “Home Page”?
Conversion-based Comparison: What is the difference between those who made a purchase (purchasers) and those who just added a product to the cart but did not buy?
Gender & Interest: Which group has a higher average purchase value, male vs. female buyers? Many more different things.
The filters we used before only showed specific data. But using comparisons, you can clearly see the differences between one data set and another. This helps you understand which audience is creating more value for your business, which will be great for determining your next marketing strategy.

Clicking on the **’Add comparison +’** button at the top left of the report will give you the comparison options. Here you can work in two ways.
The Ways
- Build New Comparison: You can create a new comparison by selecting a completely new category or dimension according to your needs (for example: a specific country or device).
- Use previously selected/saved categories: Also, if you have created any comparisons before, you can re-select them and compare the data very quickly.
Advantage: As a result, you will see the data of the specific category you selected as well as the data of ‘All Users’ on the same screen. Which will help you understand how your targeted users are performing compared to general users.
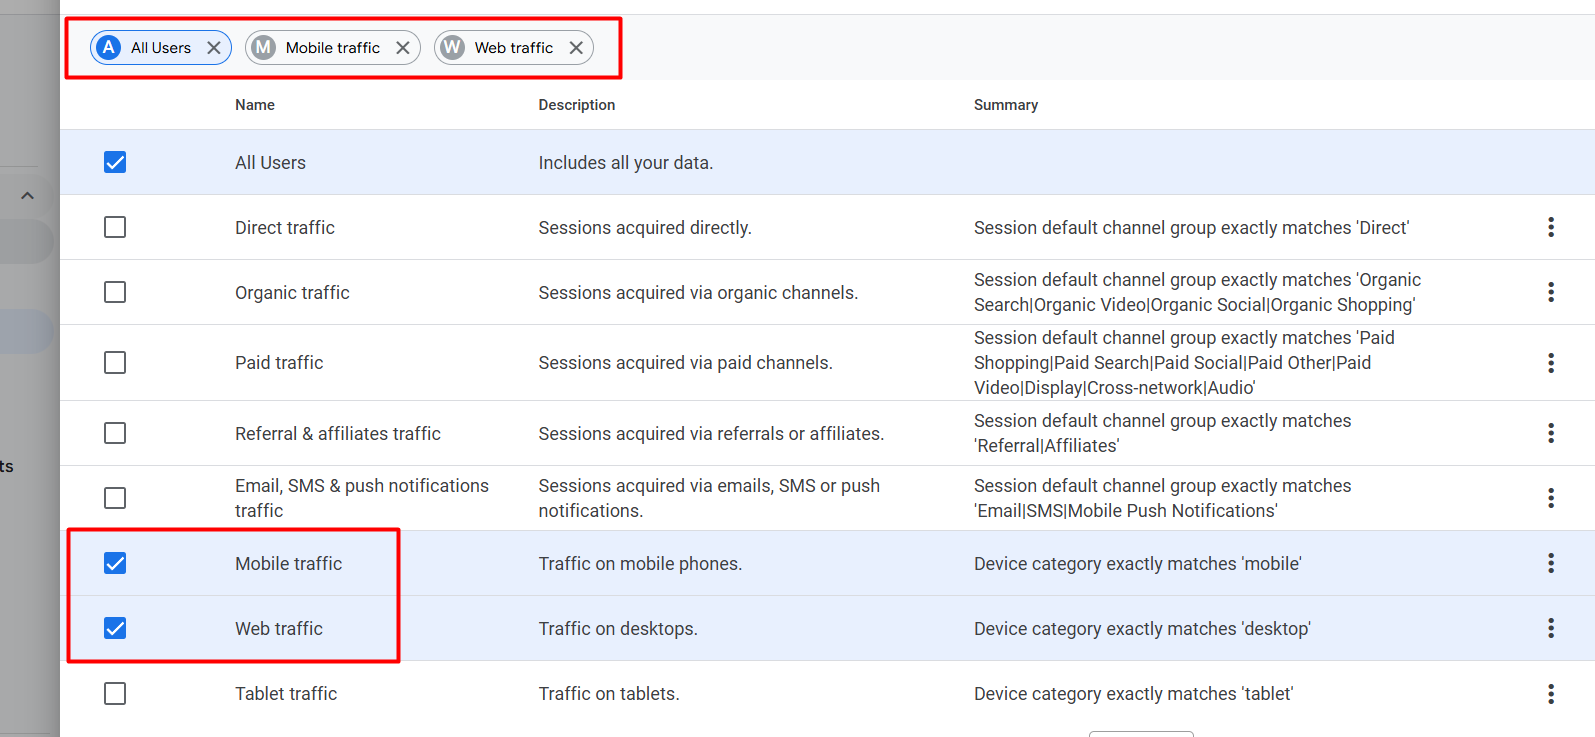
If you look at the image above, you can see how we have selected **’All Users’** as well as two other specific categories— **’Mobile traffic’** and **’Web traffic’**.
What changes will this make to the report?
- Compare in the same frame: Now you will see three different colored lines on your graph. One will show your website’s total traffic (All Users), the second will show data only for mobile users, and the third will show activity for desktop or web users.
- Performance Gap Analysis: You can easily see whether your site is more popular with mobile users or desktop users. It will even become clear which device has better conversion rates.
Although Google Analytics 4 has some default options, sometimes we need to compare data using our own or custom logic for our business needs.
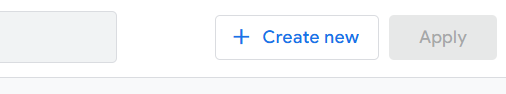
If you want to create a comparison with your own custom logic, click on the ‘+ Create new’ button shown in the image.
This gives you complete freedom to set your own dimensions and values.
A real example of the Comparison Setting in GA4
This example will show you how you can find answers to very specific questions for your business without being limited to the default options.
Our main goal here is
- To isolate only **female** users from the total traffic.
- And to find only those female users who visited your site from **the United States**.
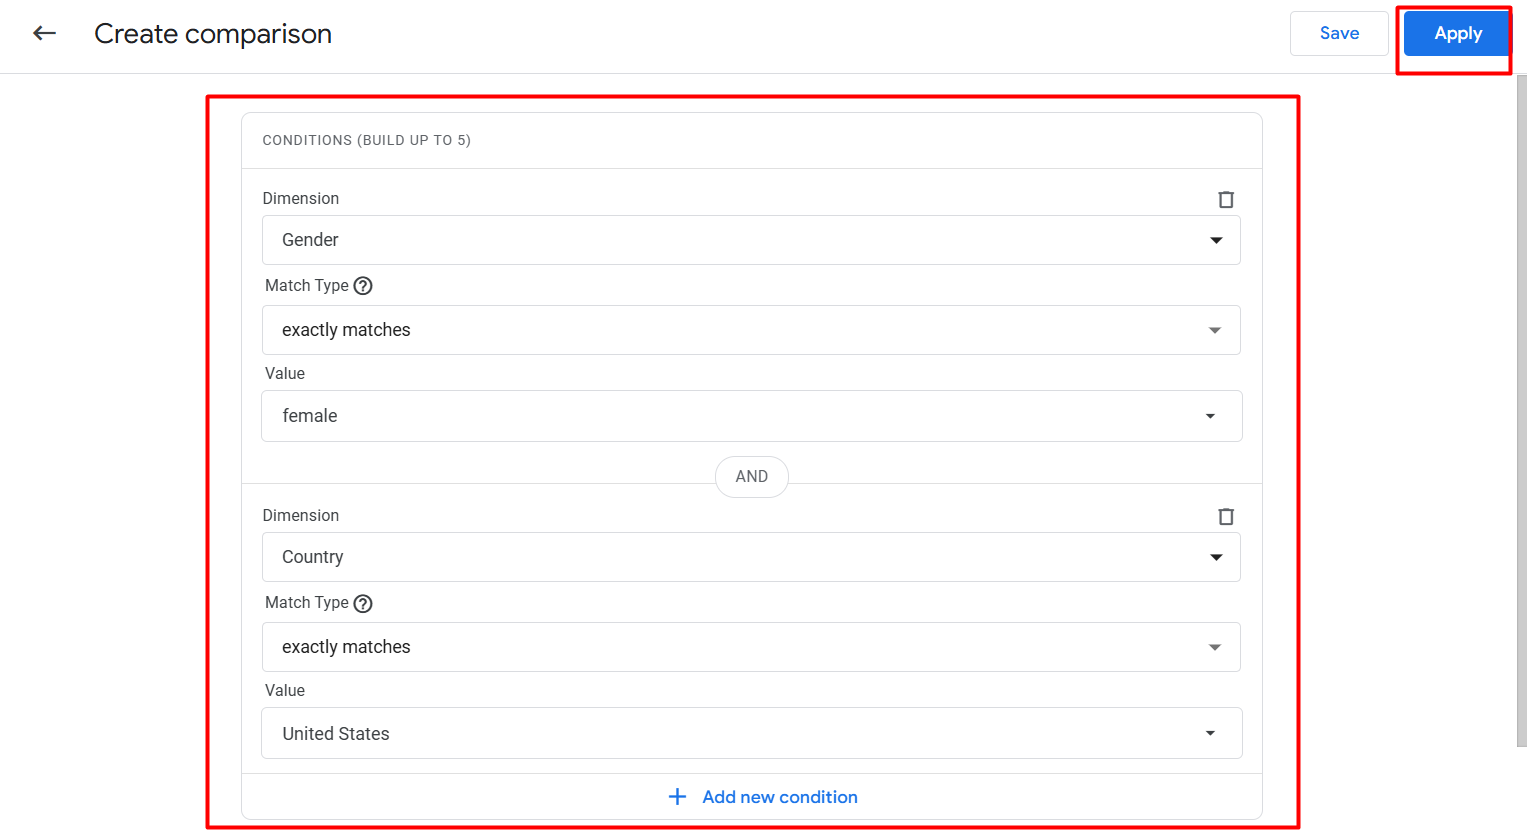
The logic is set up in the image as follows:
First condition: **’Gender’** is selected as the dimension, and the value is given as **’female.’
Second condition: Then click ‘+ Add new condition’ and select the dimension **’Country,’** and the value is given as **’United States.’
Result: Due to the **’AND’** logic in the middle, Google will now only show you data where both of these conditions are met. That means you can now know with pinpoint accuracy how American female customers are behaving on your site.
Finally, click the **’Apply’** button in the top right corner, and the report will be generated according to your custom logic.
Similar to the filter options, you can create very powerful analyses using different **dimensions** in the comparison section. Here you can organize your data in two ways.
The way
- Single Comparison: You can view data using only one dimension if you want.
- Advanced Comparison using ‘AND’ logic: Like filters, you can build your own logic by adding multiple conditions. For example, you want to see “users who are using **mobile** **AND** whose location is **the United States**.”
Creating comparisons using single or multiple dimensions in this way makes your data reading much more accurate. You can easily understand which specific segments of your business are the most profitable and where improvements are needed.
Finally, my advice is that before using these “GA4 filters and comparison” tools, you should have a good understanding of each dimension of GA4. Once you understand what type of data each dimension represents and what is under which category, it will be much easier for you to create conditions. Then the GA4 filters and comparison settings will be so easy for you.
The more dimensions you know, the more accurate your data analysis will be, and you will be able to extract the results you want very easily. So take your time to explore the dimensions. So then you can use the GA4 filters and comparison settings so easily.