
Regular data analysis is essential to understand your business properly, and GA4 is one of the best tools available today for this analysis.
To understand the real state of the business by analyzing data through GA4, it is important to have a clear idea about three basic things at the beginning. They are,
- Segments.
- Dimensions.
- Metrics.
So today in this article, we will explain to you the total things one by one. Segments Dimensions Metrics.
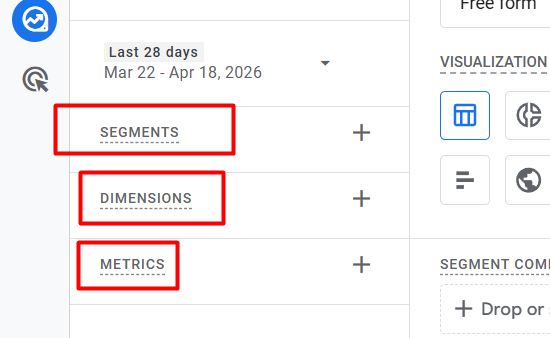
Only if you understand these things deeply will you be able to create the right conditions or conditions according to your needs while analyzing data and get the perfect report. So the main purpose of this article today is to explain these three things very simply so that later you can take maximum advantage of them during data analysis.
Segments
Simply put, a ‘segment’ in GA4 is a tool that allows you to isolate a specific group of users or visitors. That is, it is possible to easily select exactly whose information you want to analyze from the vast data of your website using segments.
You can use this option to isolate only a specific group of people without seeing everyone.
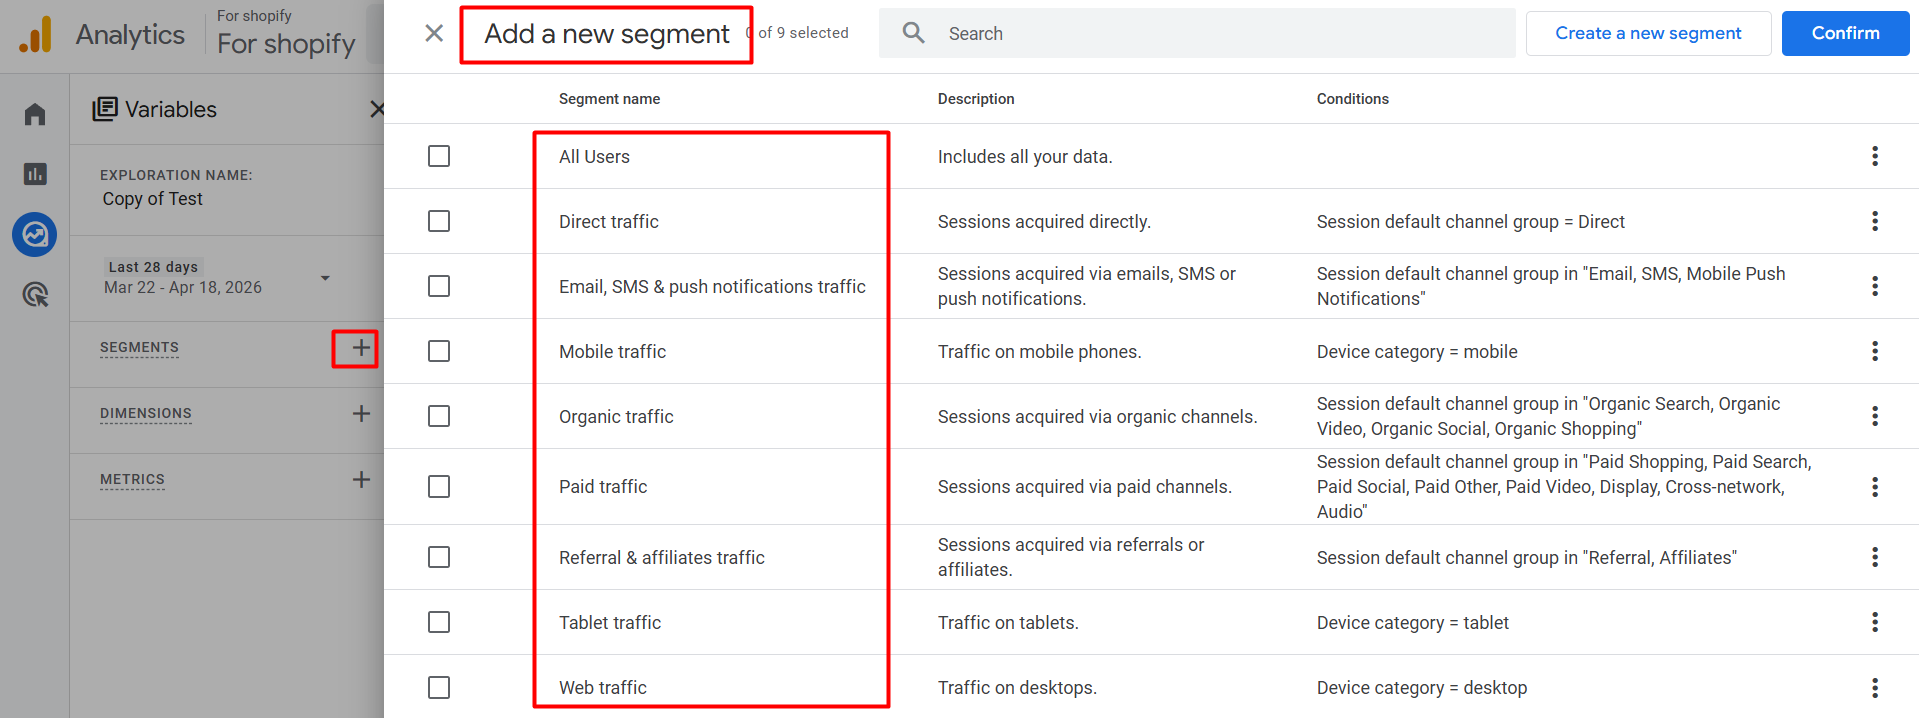
As you can see here, GA4 has pre-created segments to make your job easier. Using these, you can easily analyze data for organic traffic, paid traffic, or mobile users separately.
In this section of GA4, you can use pre-made segments, as well as create your own or custom segments according to your needs.
That is, if you want to filter data according to your business type or a specific goal, you can use the ‘Create a Segment’ option to set your own conditions. This gives you full control to analyze the behavior of your audience or visitors in more depth and precision.
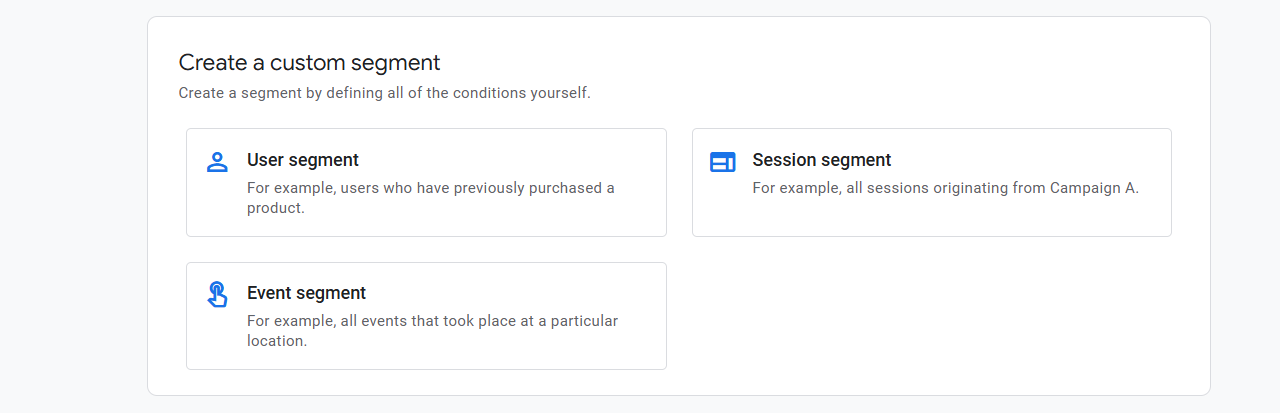
Here you can see three different segment types: one is “User segment,” the second one is “Session segment,” and the third one is “Event segment.” Let’s explain all of them.
Example
Suppose a user came to your website and completed these three events—Page View, View Item, and Add to Cart—and left. After a while, he came back to your website and did the same events (page view, View Item, Add to Cart) a second time.
Now if three different questions come to your mind while analyzing the data, then the answers will be exactly like this:
- User Segment: If the question is asked— ‘How many users did the View Item event?’ Then the answer will be— 1 person. Because there was only one person. Whenever you want to see a user-based report, that is the user segment.
- Session Segment: Again, if you are asked— ‘In how many sessions did the View Item event occur?’ Then the answer will be— 2. Since he came to your site twice at different times, there are two sessions here. So whenever you want to filter data based on sessions, it will be called a session segment.
- Event Segment: If the question is asked— ‘How many times has the View Item event been completed?’ then the answer will be— 2 times. Here the data is displayed according to the number of events. This is the event segment.
Example from the Setting
If you want to see this more perfectly from the setting, then
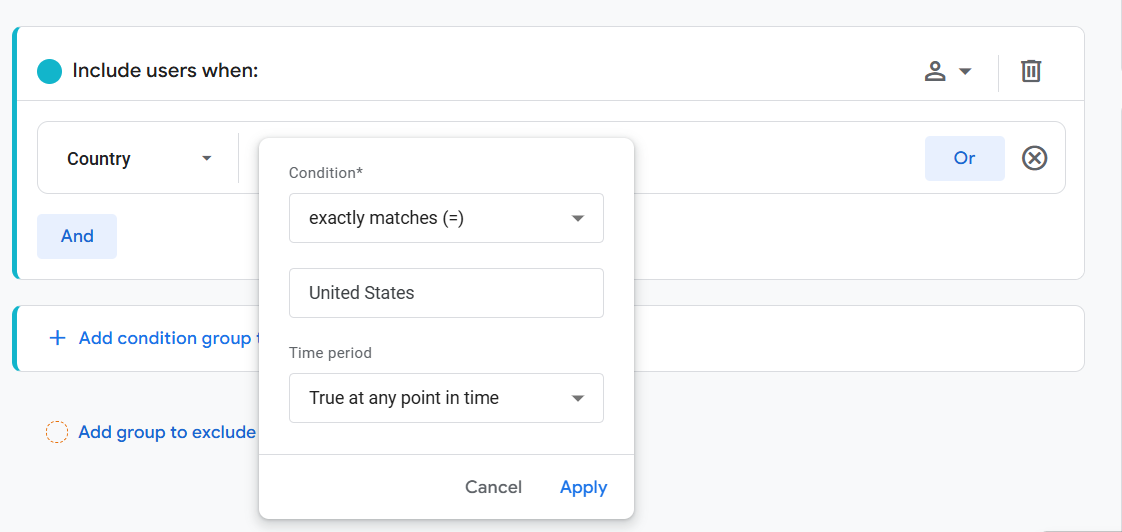
If you look at the screenshot above, you will see that I have selected the Country ‘United States’ as a condition within the User Segment. As a result, my report will now only display data for users who visited my website from the United States.
Similarly, if you select a country through the Session segment, you will see how many sessions or visits were completed on your website from that specific country.
Again, using the Event segment, you will be able to know exactly how many times your desired events (such as clicks or purchases) occurred from that specific location. This way, you can examine the data from different perspectives according to your needs.
In a line
Finally, if I try to explain to you in a word about segments. Through this you can determine exactly whose data you will analyze. Do you want to see data from all users of your website, or do you want to work specifically with paid traffic or organic traffic?
Even if you have a special condition, you can use custom segments to isolate exactly that data. In other words, segments are the name of choosing the part you need from the vast sea of data.
Apart from this, keep in mind one more thing. When you create a condition under User Segment, you will only get data from users who meet that condition. Similarly, through the condition given in Session Segment, you will see data from those specific sessions and the same rule applies to Event Segment.
So, before creating the right segment, it is important to understand very well from which perspective you want to see your data. Because the correct use of segments will make your data analysis perfect.
Dimensions
Simply, if I told you, a dimension is a characteristic or identity of data. When you look at a data, what that data actually says about whom or what is the dimension. It basically works as a name or category of the data.
Dimension, we can divide the data into different groups.
Suppose you select ‘Country’ as a dimension. Now you will see which countries the users who visit your website are from. Here ‘Country’ is a dimension through which you can see the data or events of users based on country separately.
But one important point, that dimension basically shows the entire data according to groups. It works a lot like a list. Remember one thing, Dimension does not target and filter a specific group separately like ‘Segment.’
Metrics
You already know that dimension helps us find groups or names of a data. But if you want to know how much data is actually inside those groups or how much is it, then you will have to use Metric. Simply put, Metric is the number or amount of data.
How does Metric work?
When your selected dimension shows you a specific name or category (such as country or device name), Metric then reveals the numbers under that category (such as how many users or how many times clicked).
Suppose you have selected ‘Country’ as a dimension. Now you want to know how many users have come to your website from which country. For this, you need to select ‘Active Users’ from Metric. As a result, you can easily see the number or amount of active users in your chosen country.
Easy way to remember:
Dimension is “what” (such as country or city), and metric is “how much” (such as how many users). Without metrics, we will never know the actual amount or number of data.
So to get accurate reports in GA4, it is very important to combine these three things (Segments Dimensions Metrics). Filtering data with segments, identifying it with dimensions, and measuring it with metrics is the job of a successful data analyst. So from now on, use these three things (segments, dimensions, and metrics) more perfectly to improve your analysis.