Already in our previous article, we explained many important things about GA4 and GTM. There we explain what GA4 is and how it works. Also, we explained how many ways you have to connect your GA4 with your website and what the best one is.
If you don’t want to miss them, you should definitely check our previous article, where we explained the type of settings you should configure after completing your GA4 installation on your website, as we are going through a series on Google Analytics 4.
Today, through this article, we will explore the GA4 dashboard. We will explore where we can obtain each type of data for our report and much more from the GA4 dashboard.
So let’s start exploring the GA4 dashboard from Home, the reports, the Explore section, and the advertising section.
Home
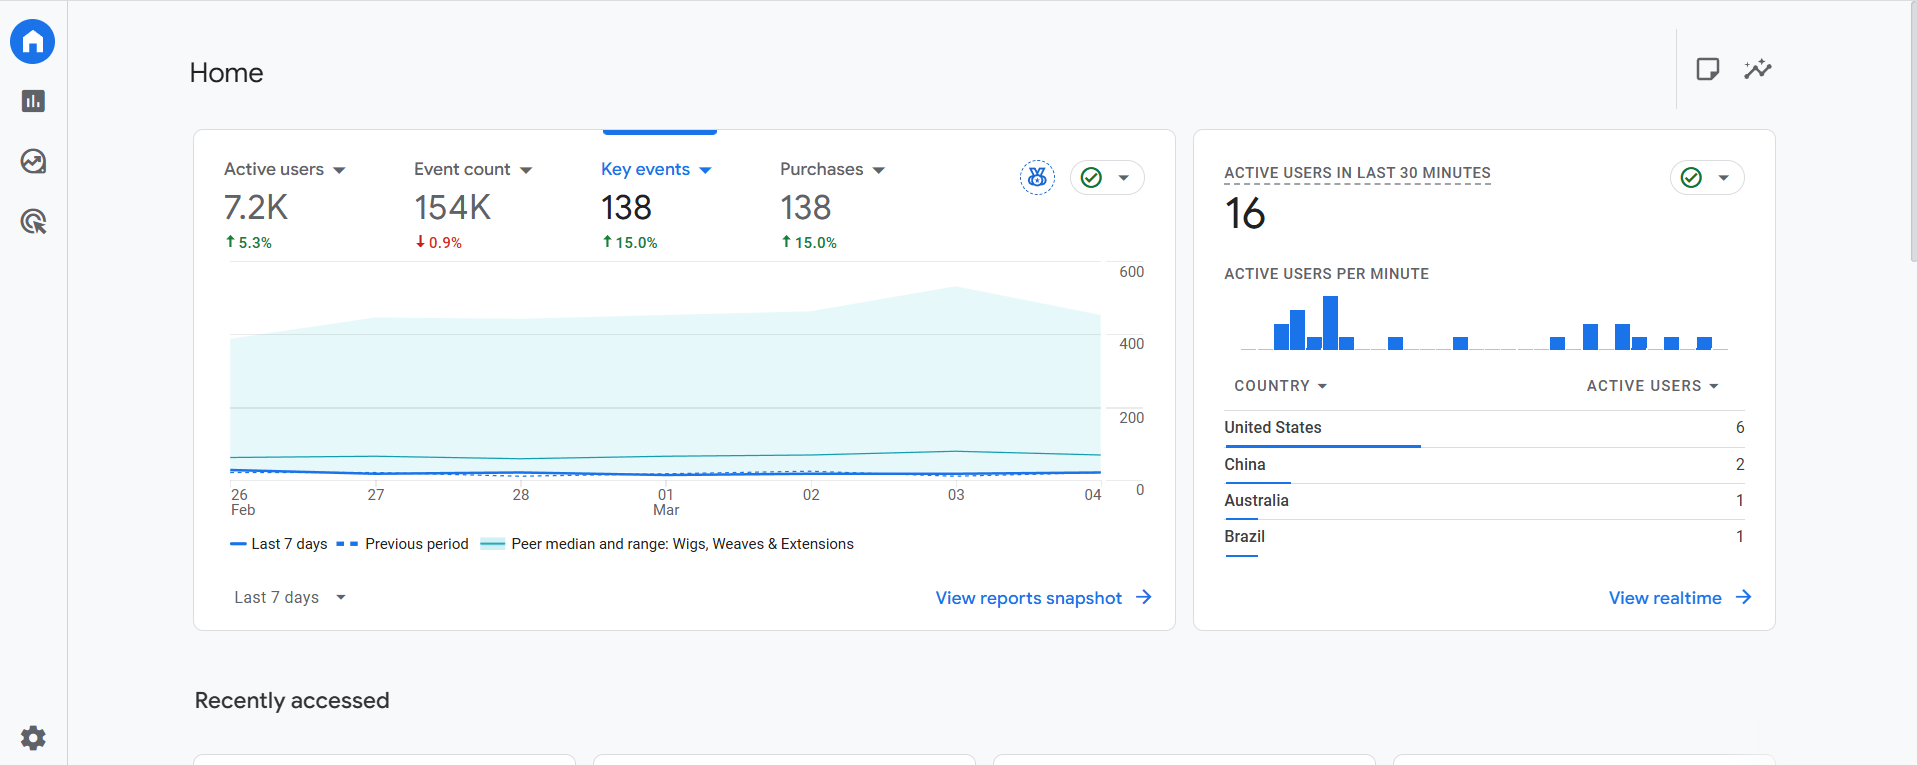
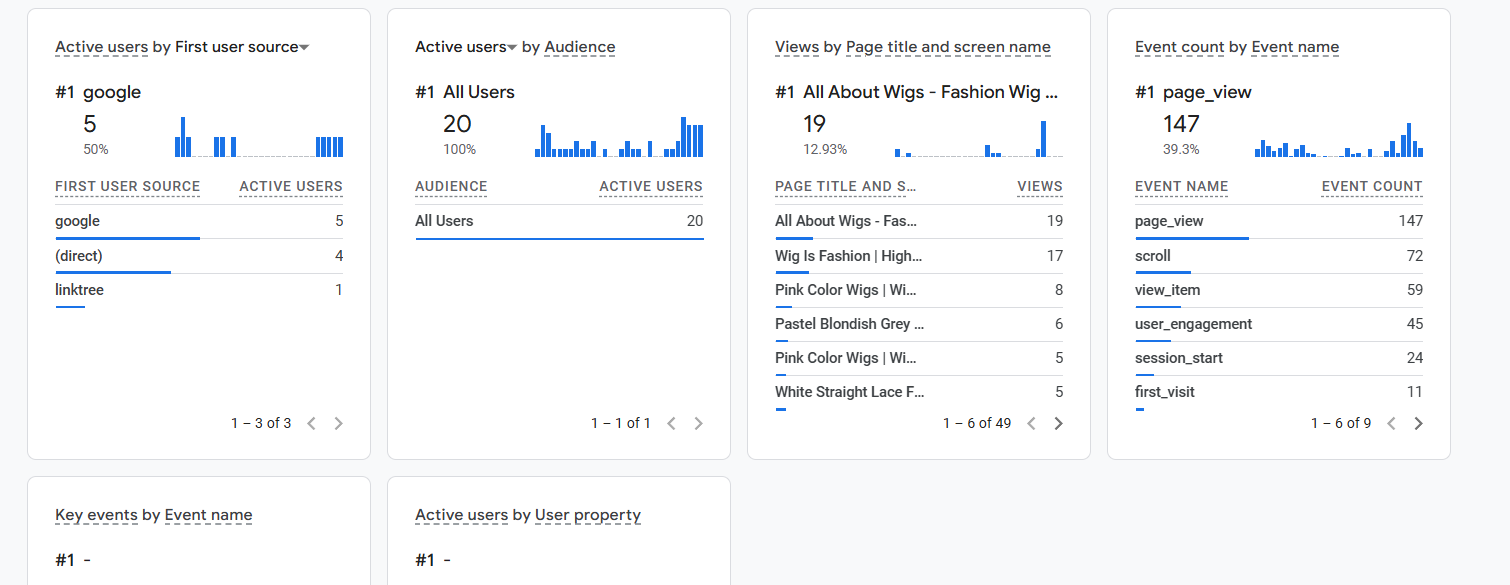
After setting up the standard or custom event, logging into your GA4 will show you this view. But this GA4 dashboard view can be different for your business. In the “Purchase” section, you can view your key event data, and the other information will remain the same.
After that, on the right side, you can see the number of active users on your site in the last 30 minutes and their countries of origin.
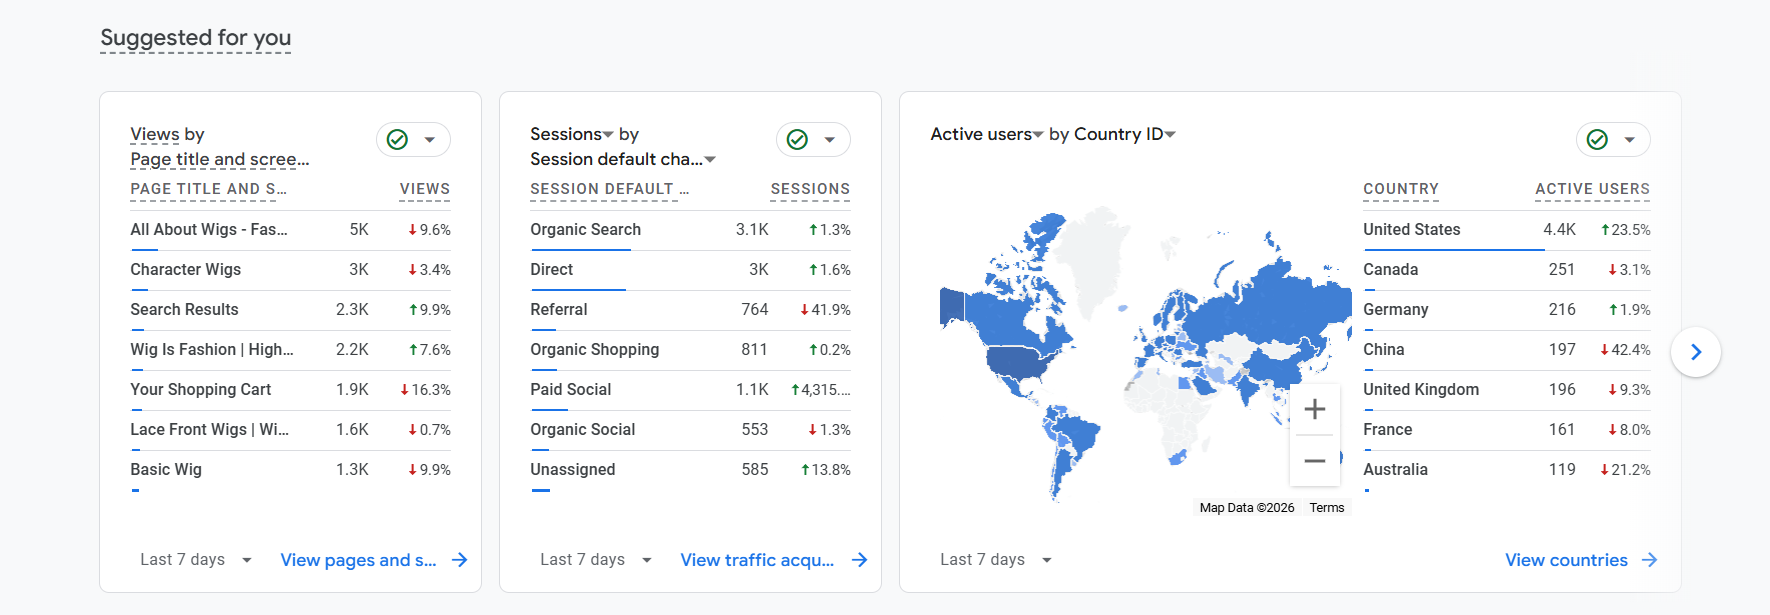
If you scroll down, you will see additional data on which pages received how many views, from which traffic sources you are getting how many users, and the number of active users by country.
Reports section in GA4 dashboard
This is one of the greatest places in GA4. This is the place where you can get many different types of data according to your events and user activity. This report section will cover data from beginner to mid-level. Here in the beginning you will get four different types of sections.
- Real-time overview.
- Real-time pages.
- Life cycle.
- User.
Real-time overview in GA4 dashboard
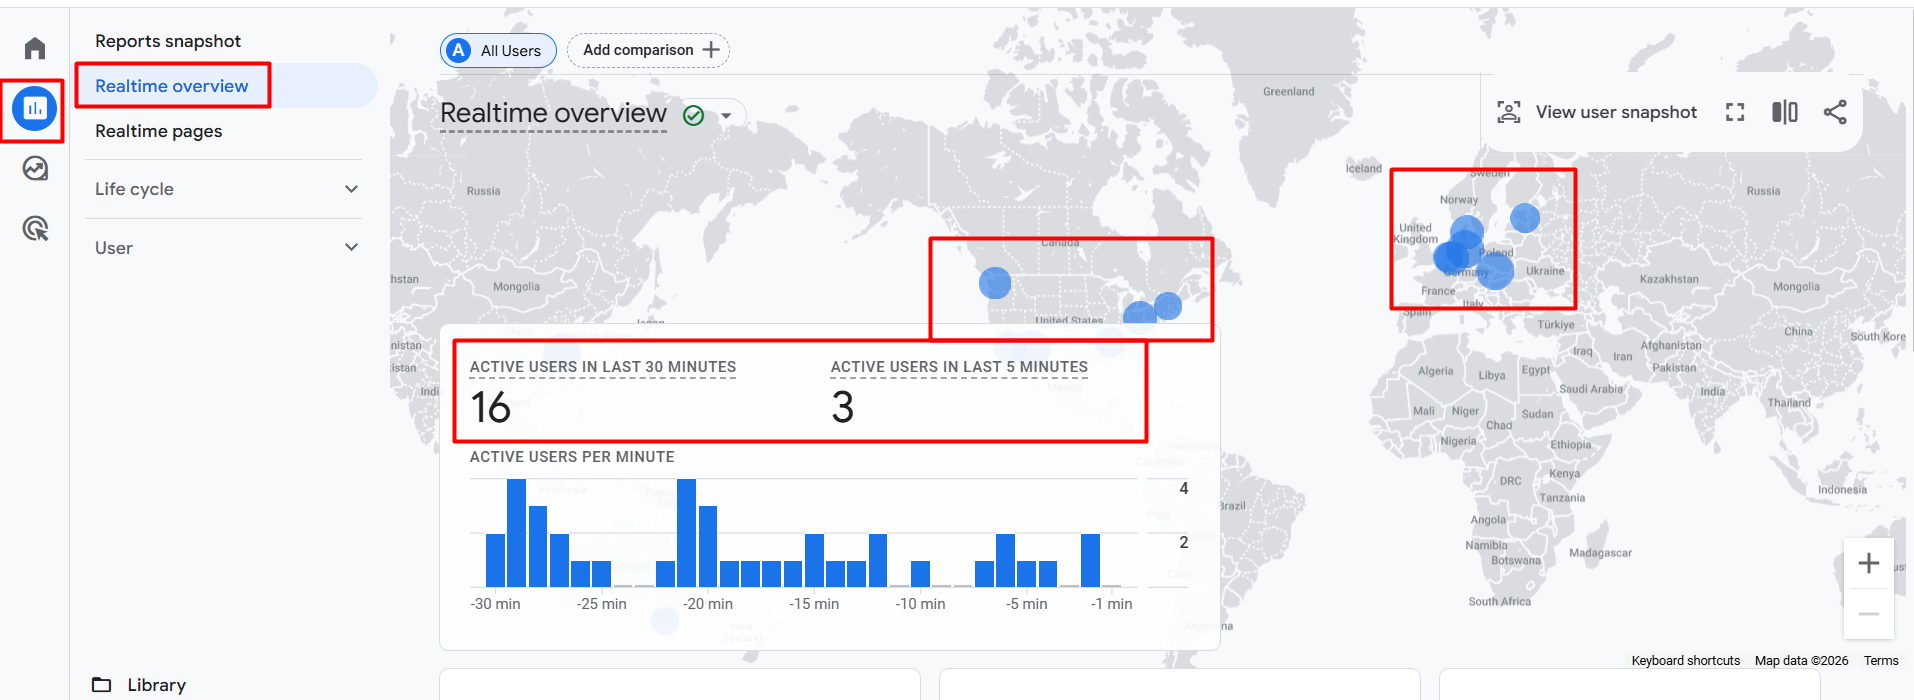
From the reporting section, if you enter the real-time overview section, you will be able to see how many active users you have in the last 30 minutes, as well as the number of active users in the last 5 minutes. You can also view the location of all active users.
Now if you scroll down, then you will be able to see some more data. You can see the source of all these active users, the page they are currently on, the types of events they are participating in, the frequency of these events, and the names and counts of key events completed by the active users.
Real-time Pages in GA4 dashboard
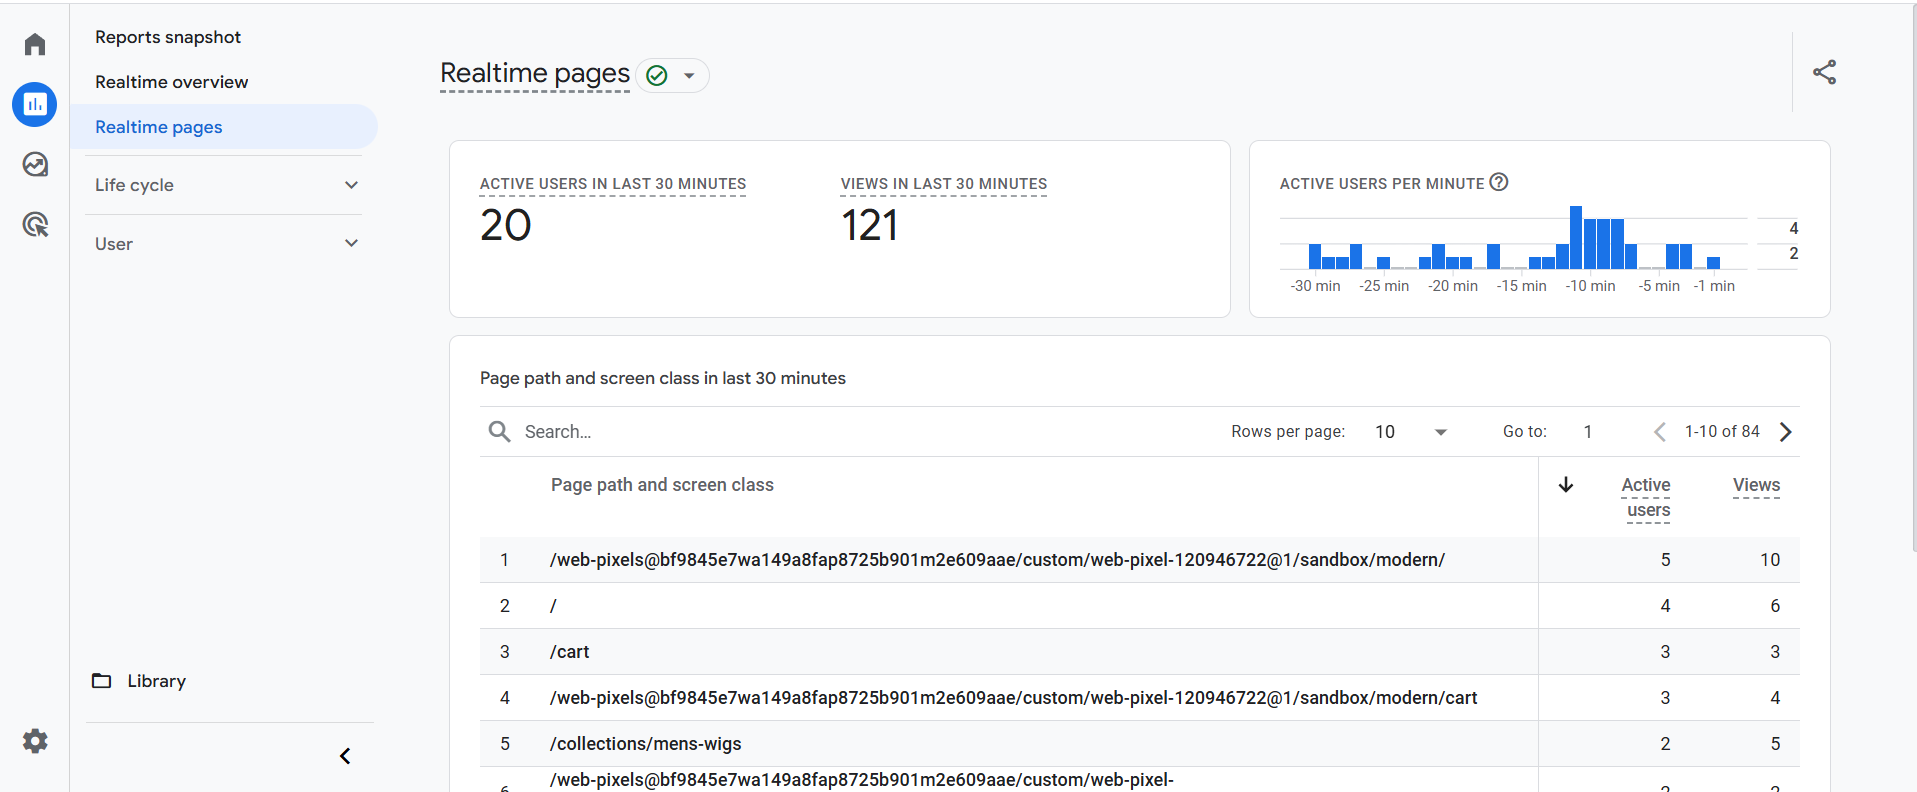
On this page, you can also find information about how many people have been on your website in the last 30 minutes, how many page views occurred in the last 30 minutes, and which pages they are visiting. Every single piece of data will be real-time based.
Life Cycle in GA4 dashboard
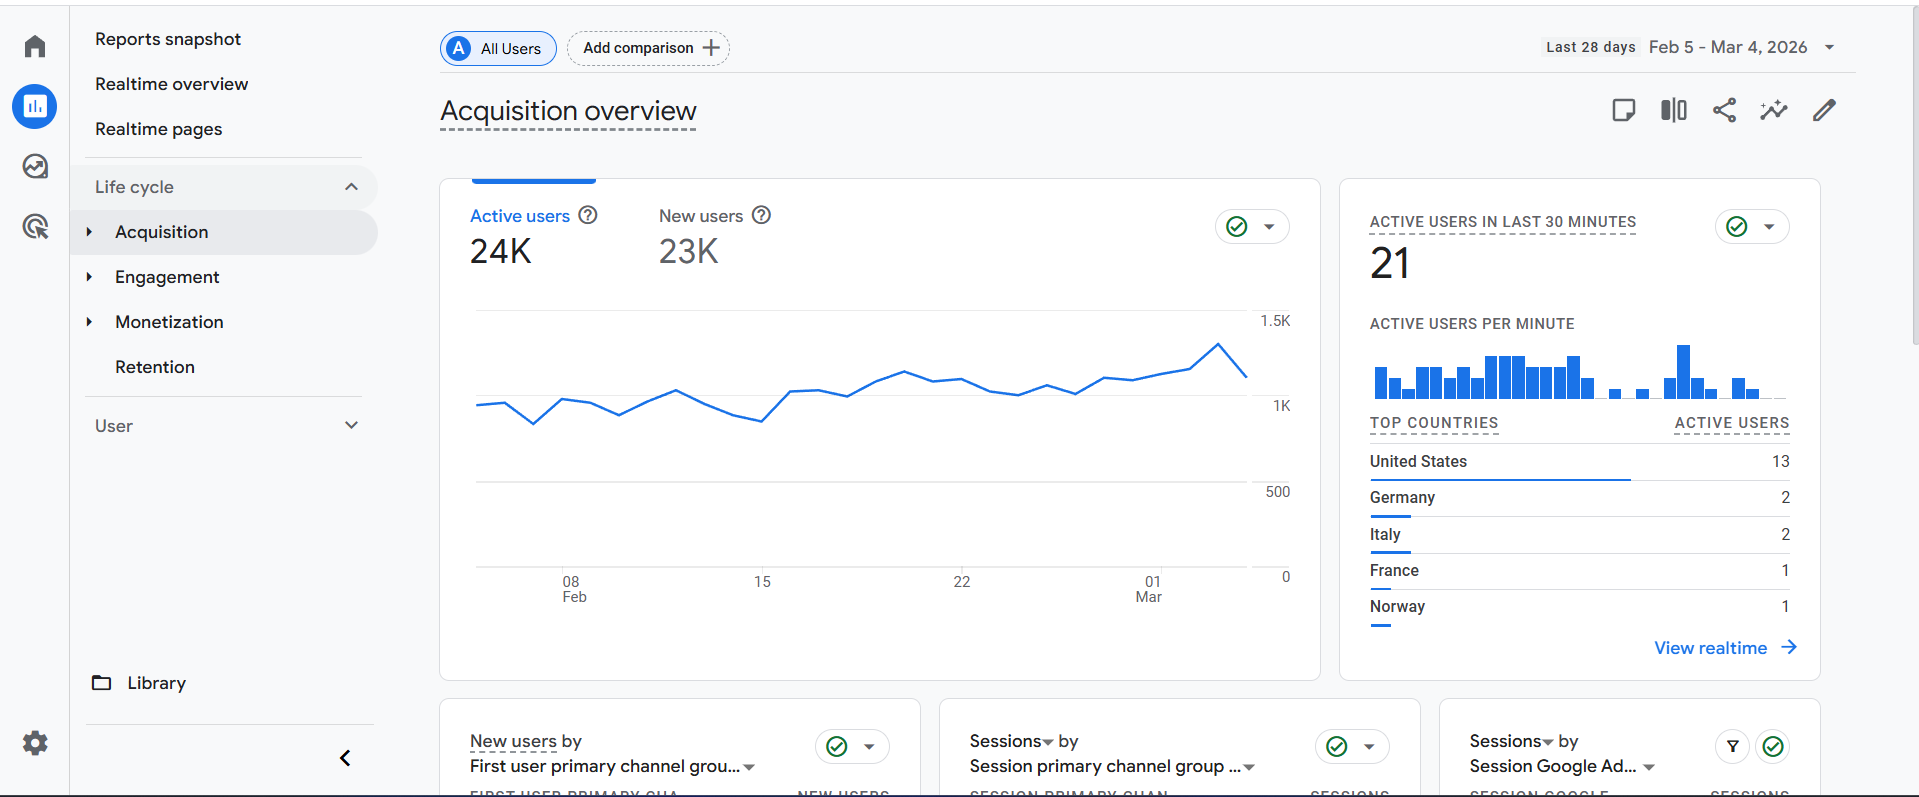
The life cycle indicates the total journey of your users on your site. For example, at the beginning, users enter your site, and you acquire them. That is why, at the beginning, you will see “Acquisition.” Through this section you can get in-depth knowledge about the source of your coming users.
Then, on your site, users will engage and complete many events, such as signing up for newsletters, participating in surveys, or making purchases. That’s why, after the acquisition, you can see the “engagement” section, where you can find lots of data on your users’ events.
Now the monetisation section. For example, if your key event is a purchase, GA4 will register one key event with a value each time someone completes a purchase. Saying that your GA4-connected website has completed a monetisation-based activity would simplify the process.
So in the monetisation section, you will get this type of data. If your key event is a purchase, this section will show you how many views, add_to_cart actions, and purchases each product received.
Also in this section, you will be able to see the purchase and checkout journey. This is the place from which you can see the purchase amount and the revenue according to the transaction ID.
In a line, if I explain, from the acquisition section, you can learn about the traffic source; in the engagement section, you can learn about the events; and in the monetisation section, you can learn about purchase events or any data-based monetisation activity.
Retention
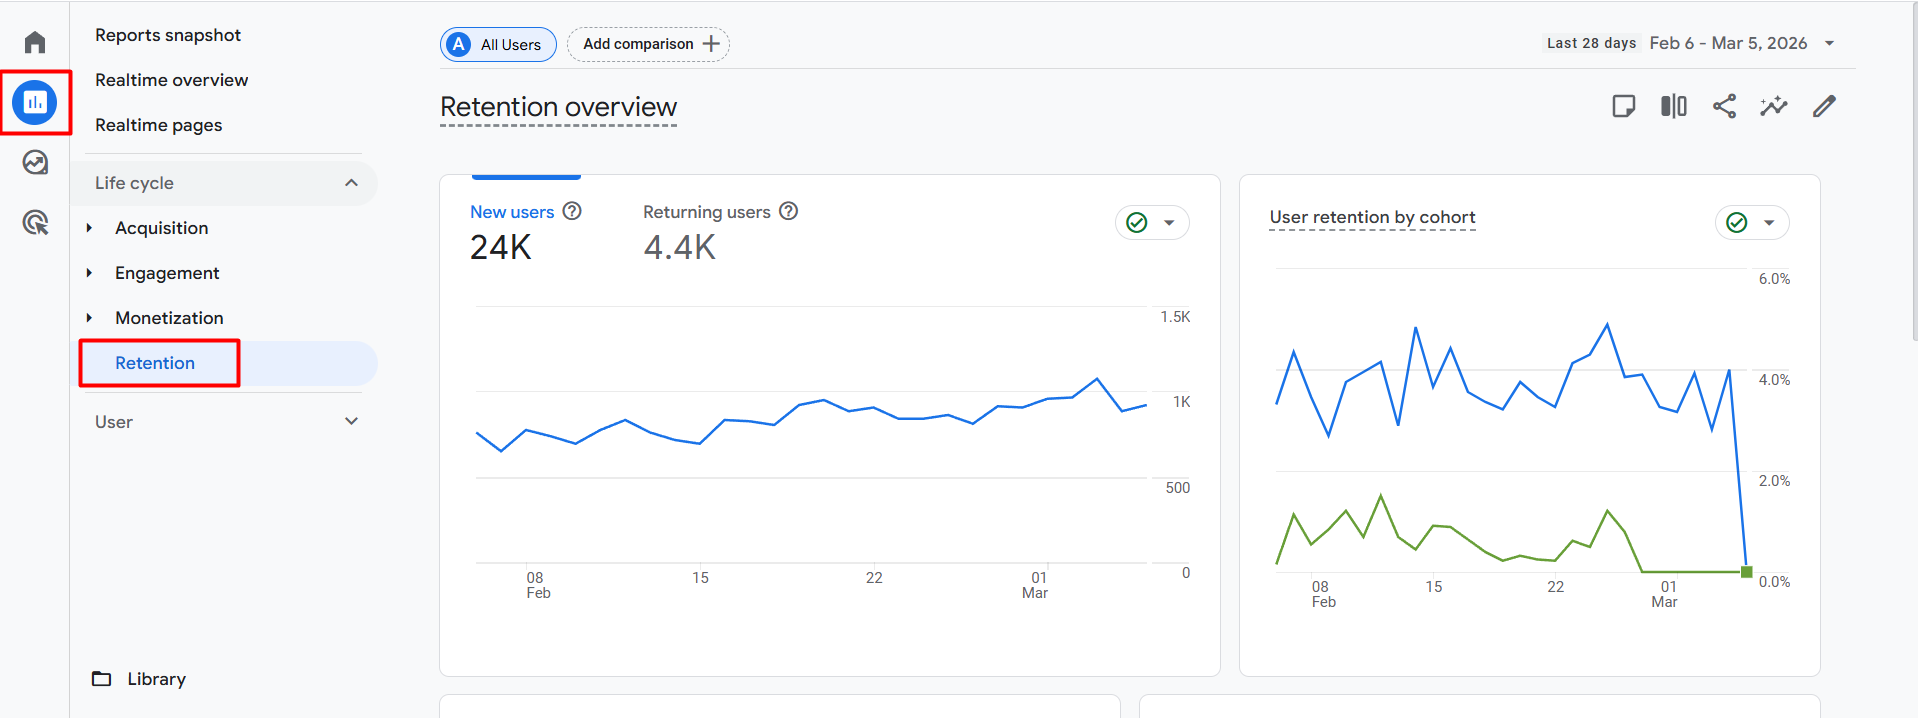
The retention dashboard is the place where you can learn about your users, specifically the number of people returning to your site. In the picture, you can see that in the targeted time, our new user amount is 24k, and our returning user amount is 4.4k.
User Attributes
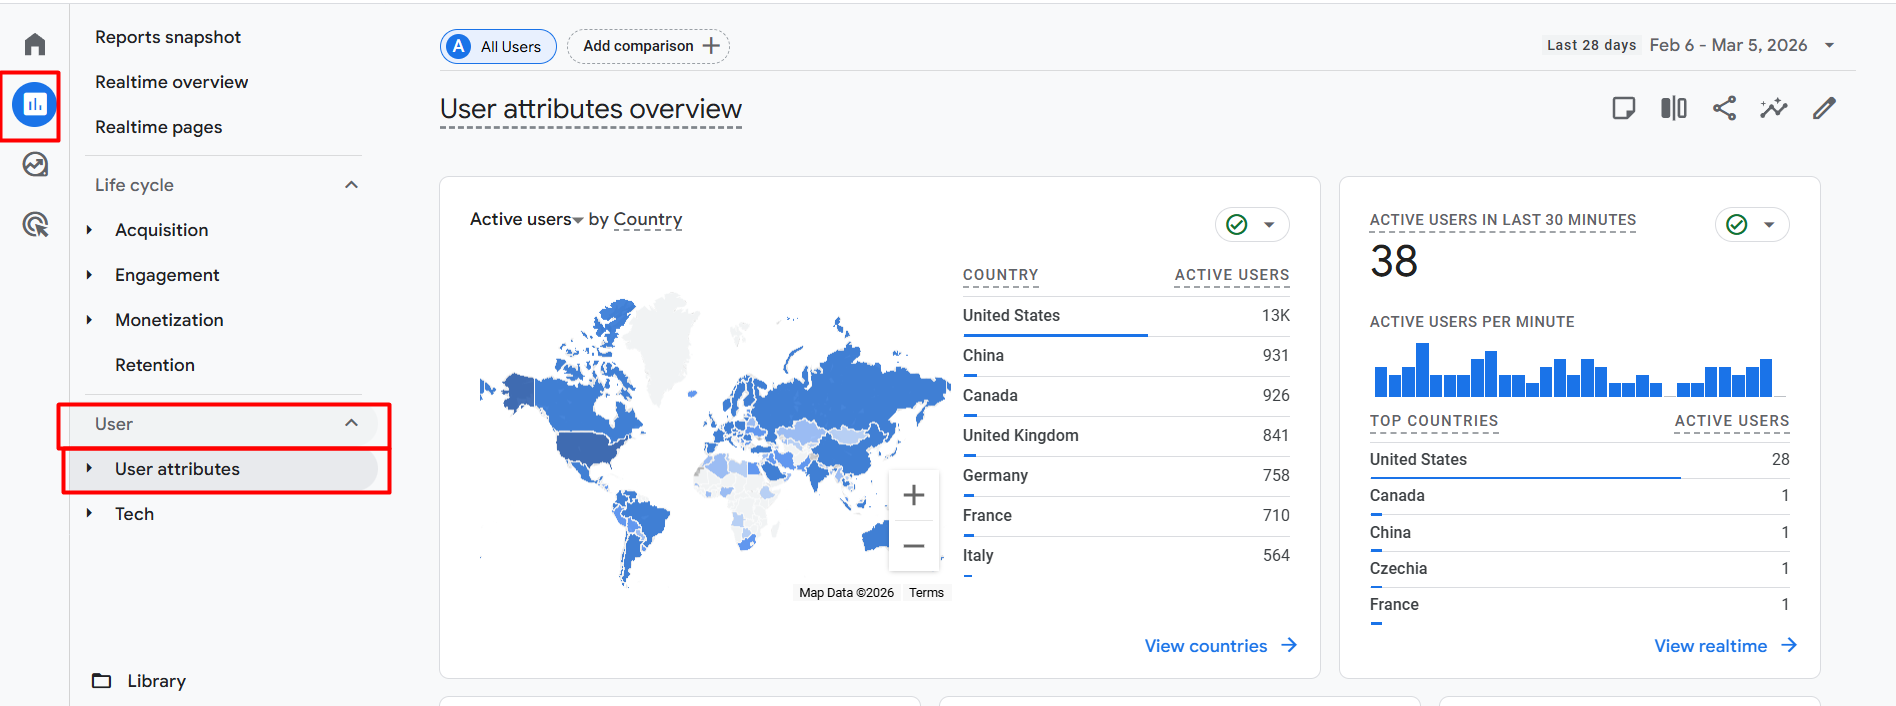
Here in the place you can get more detailed data according to the user’s demographic location. This demographic shows how many new users you have, where they are, and how much data, revenue, ratios, events, and other types of data you get from each location.
Tech
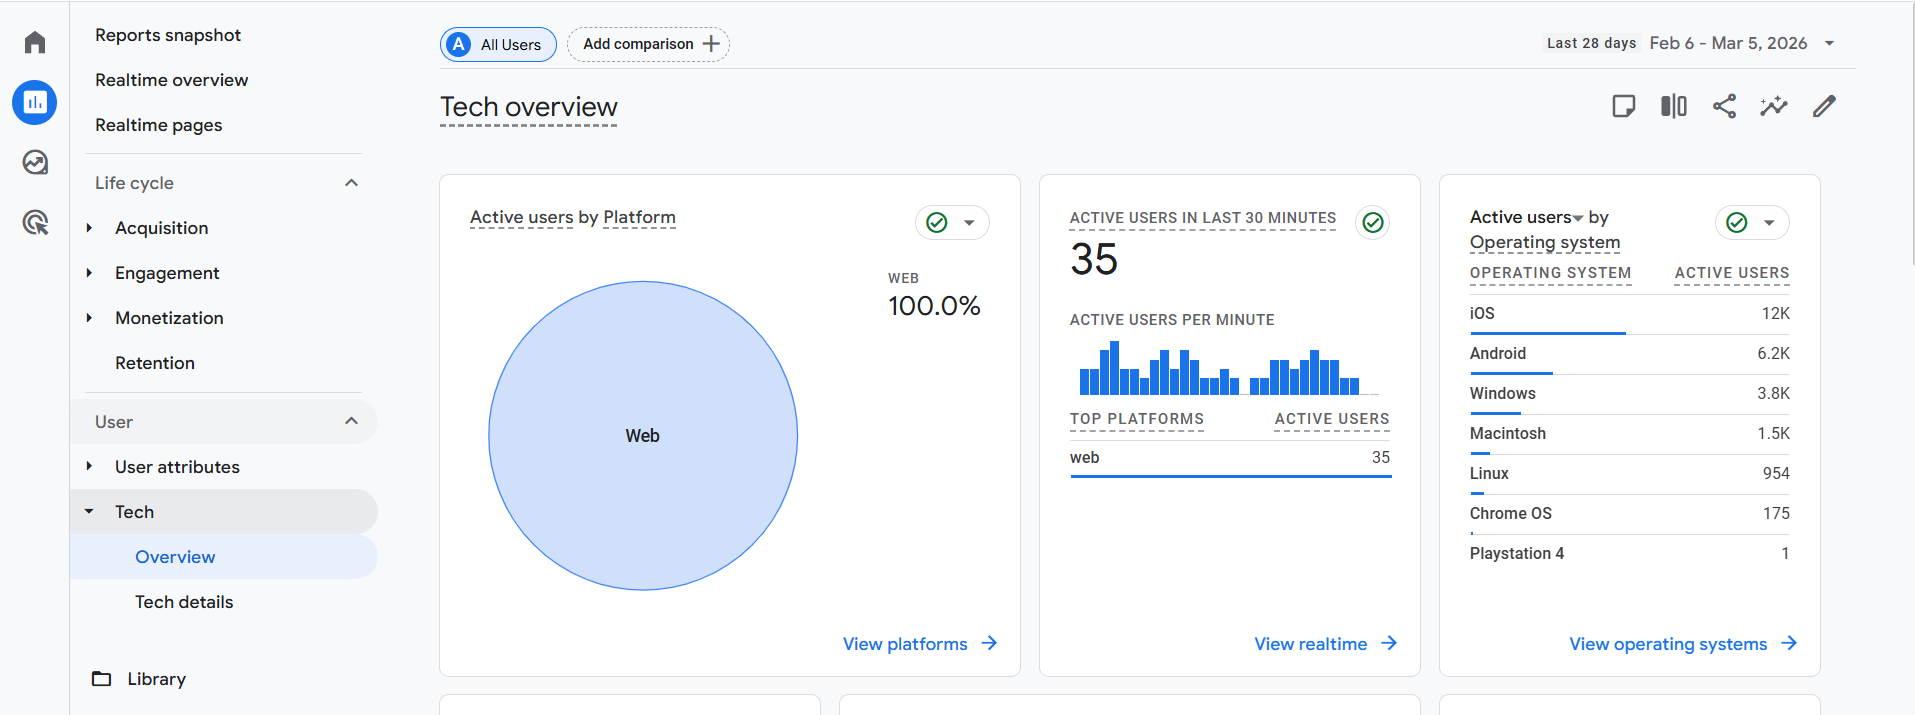
In this section, you can gather greater knowledge of the type of platform or operating system your users are using. Also, in the last 30 minutes, which platforms have all of your active users come from? You can also learn about your users’ devices, their ratios, and new tech information.
GA4 Library
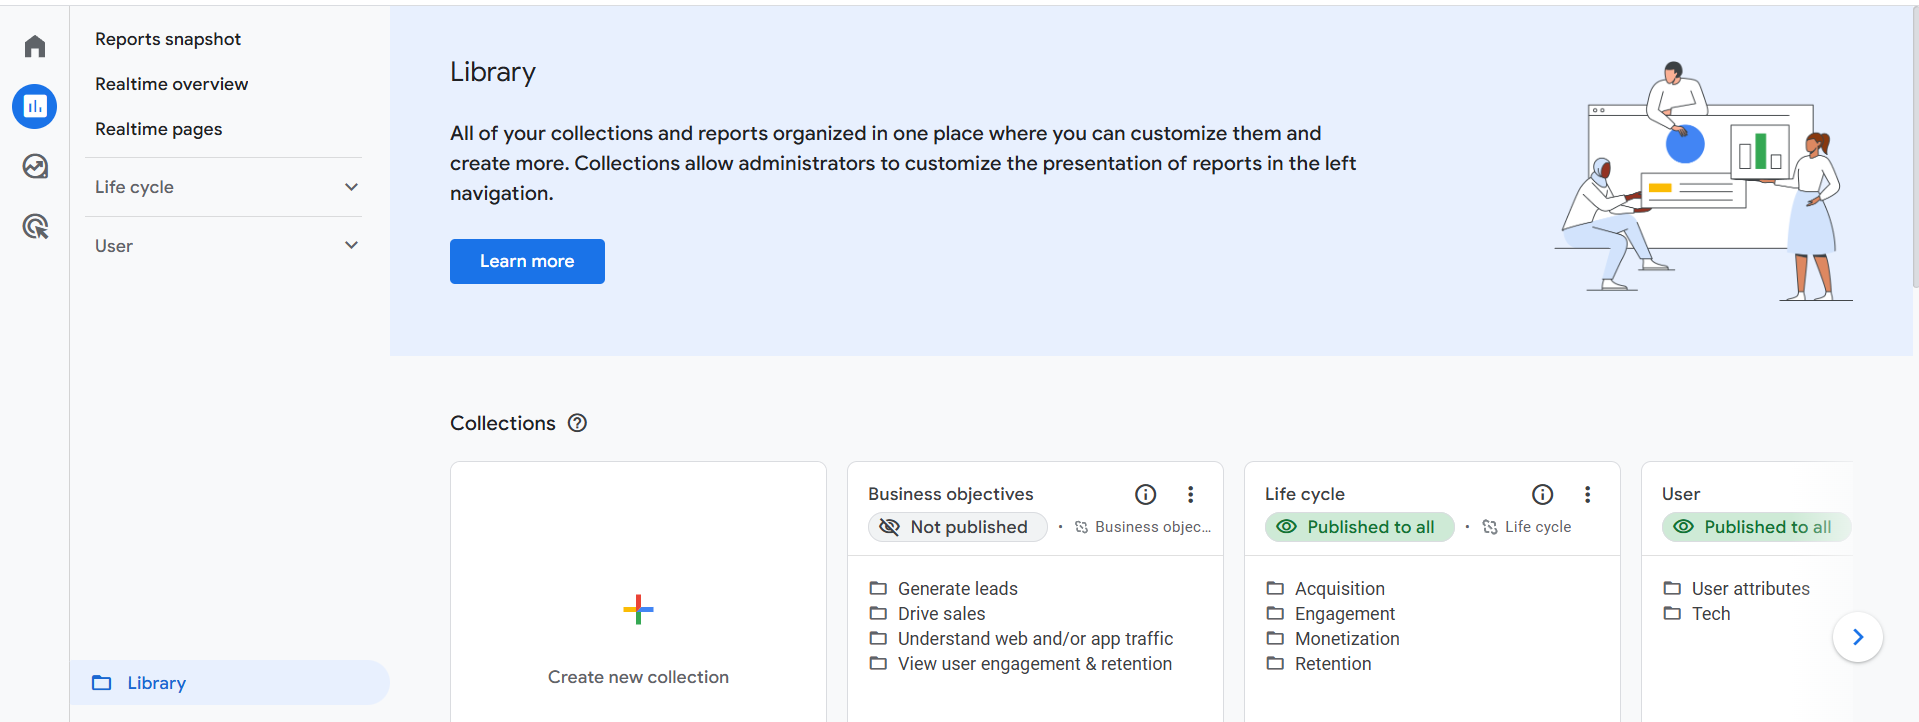
From here, you can create more reports, like the life cycle, as per your needs. In our upcoming article, we will talk about them in detail: how you can create any report or collection as per your needs or customise them.
GA4 Explorations
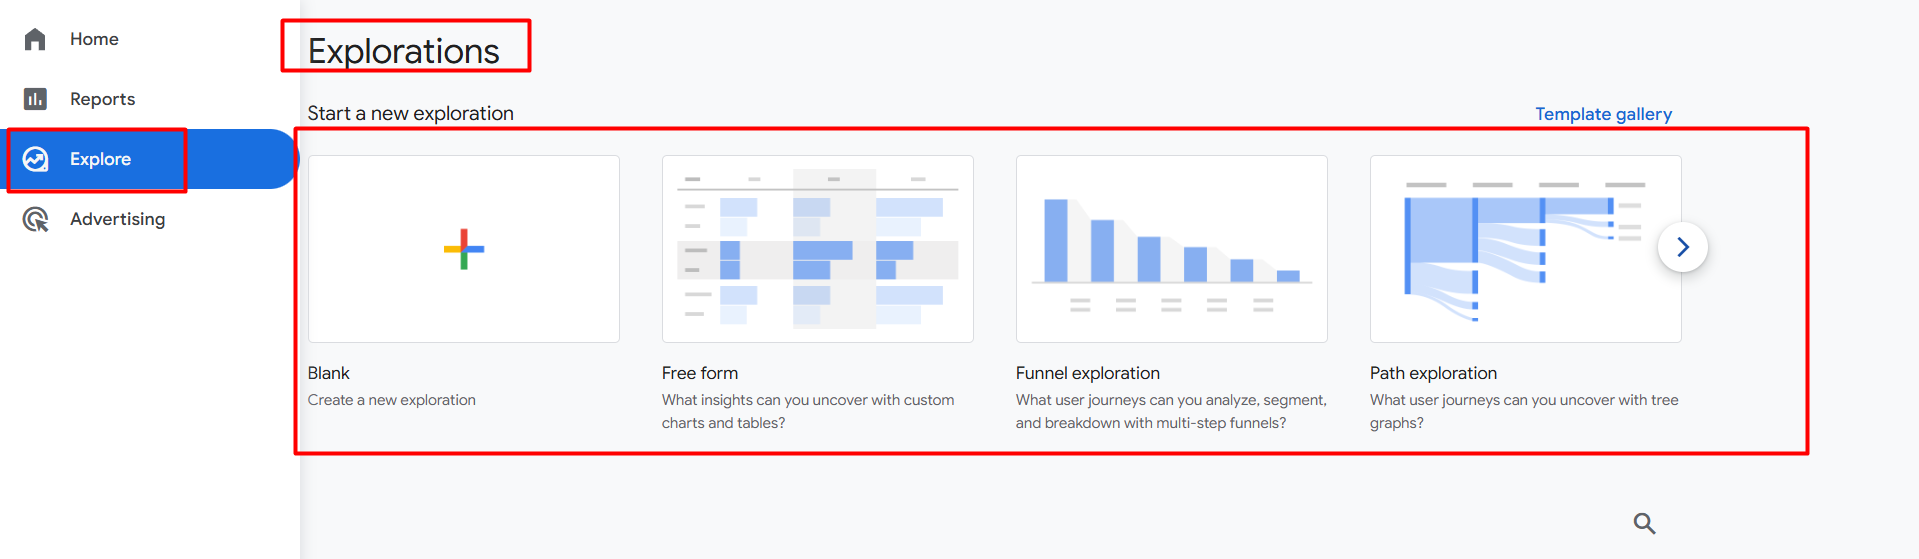
We already explored the reporting section, from which we can get a lot of different types of information, but still, the report section can’t give you one customized report as per thinking.
If you want to create a detailed report based on your thoughts to make marketing decisions or understand any activity, the explorations section can be the best option for you.
GA4 Advertising
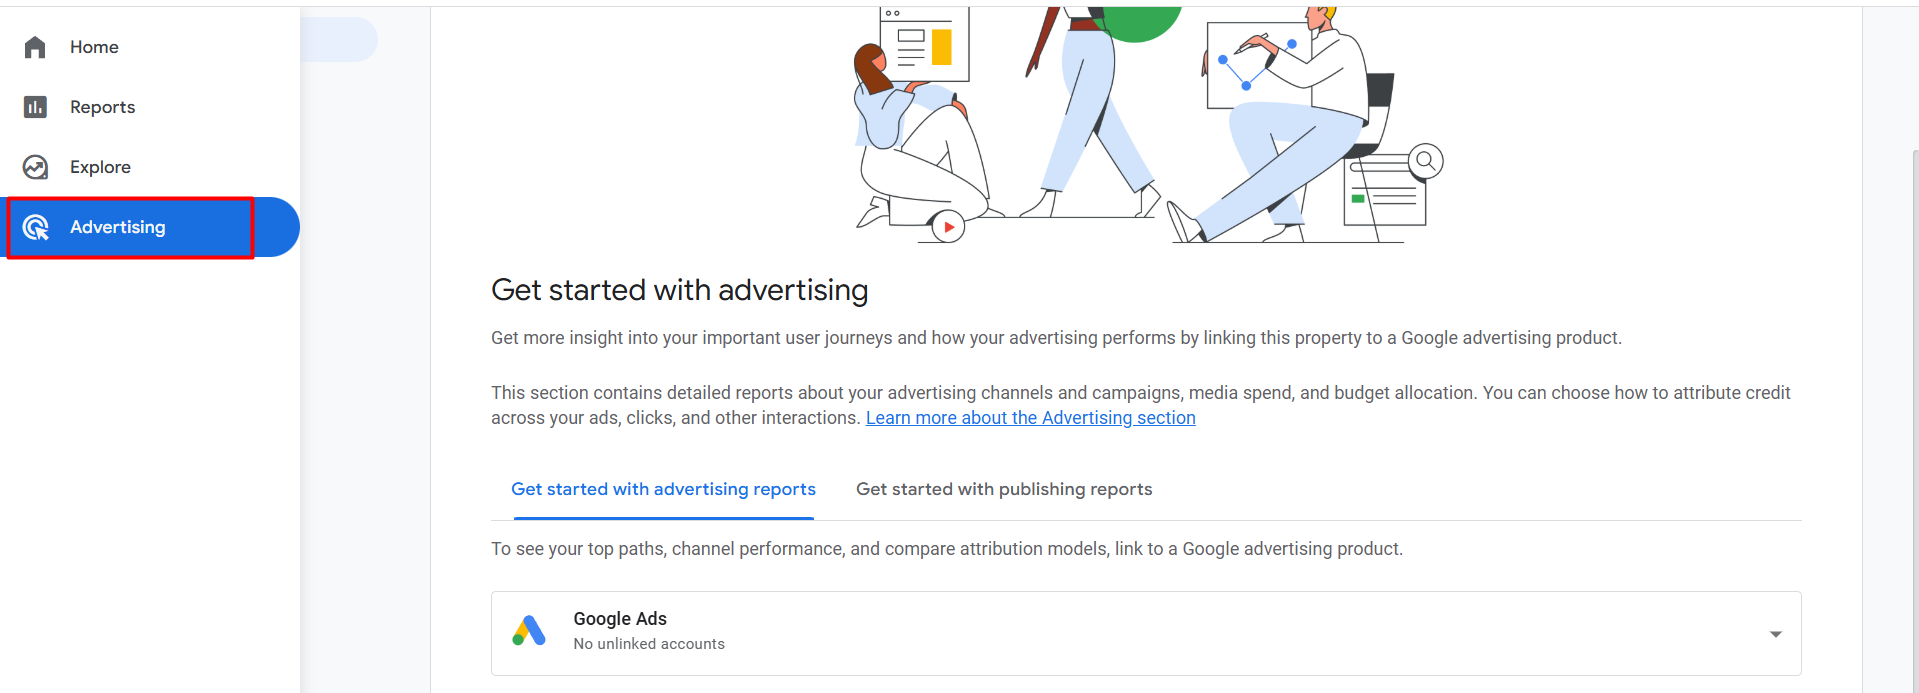
If you connect any account with your Google Analytics 4, then you will be able to see data here in the section.
Admin
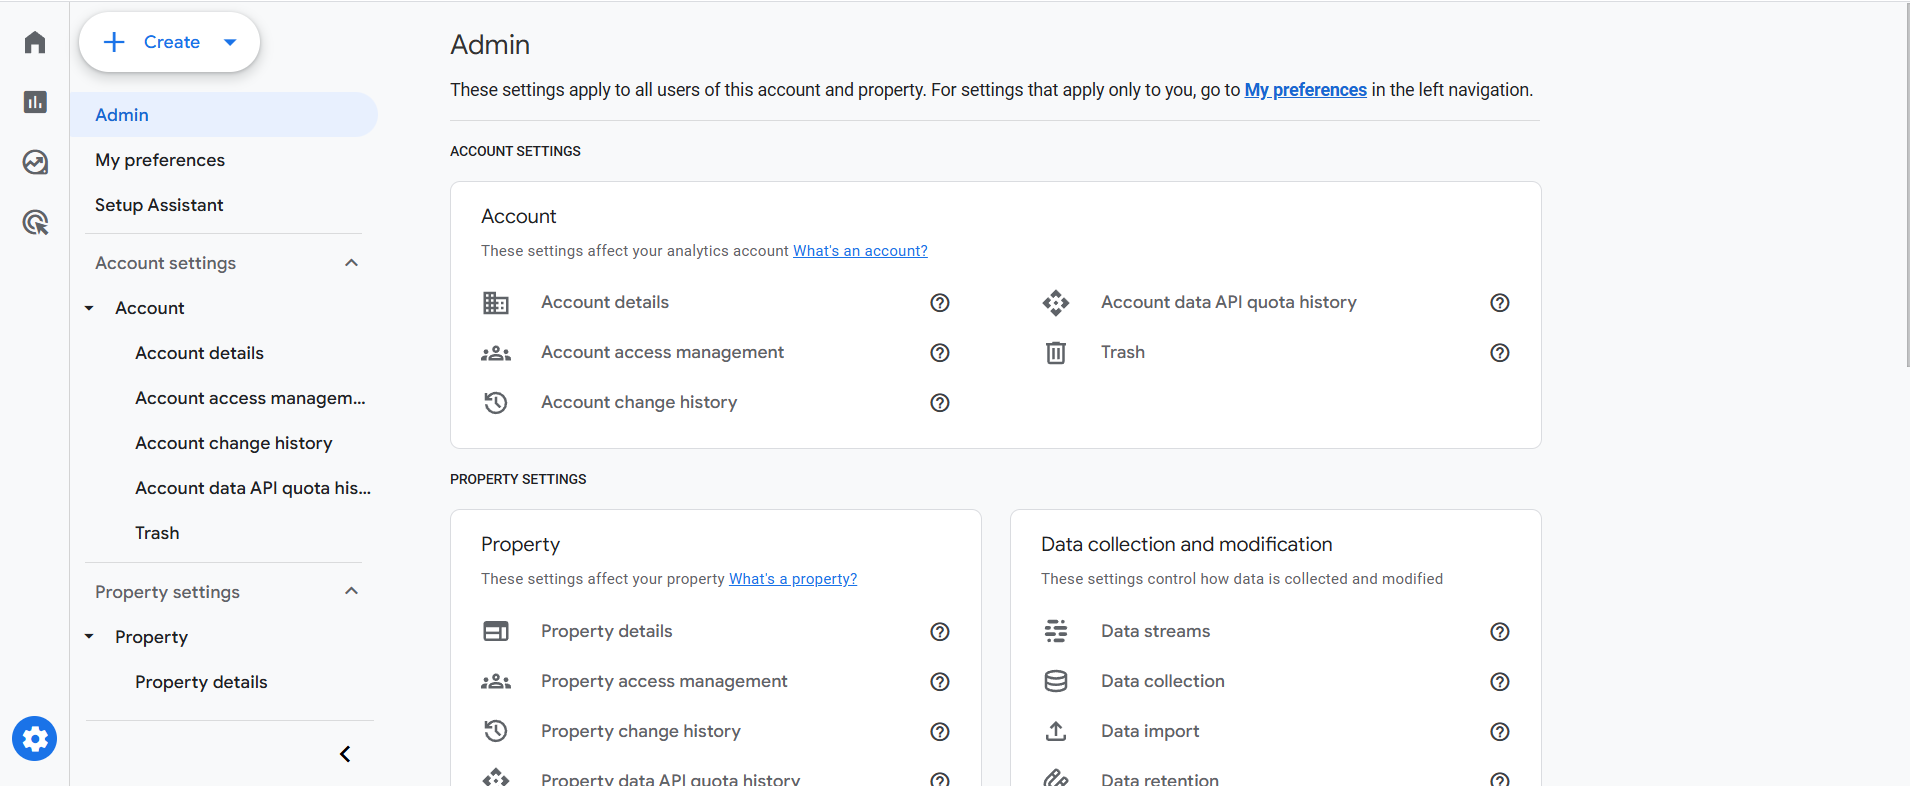
From the beginning of this GA4 series, we already talked about many settings. And all of the settings are under the admin section. You can share your account access or change anything in your GA4 from this section.
If you want to enter data streams, connect accounts to GA4, or do anything with your events, go to admin.
Also, there are many other things we can do in this admin section. Already in our previous article, we explained some important settings that you should make after completing the GA4 account installation on your site.
In a single article, it isn’t possible to discuss all the settings in detail, but we will explore each one over time, so don’t forget to follow us for more updates.