This is one of the new articles from our Google Analytics 4 series. In the previous article, we provided an overview of GA4 (Google Analytics 4) and explained where you can find out which type of information.
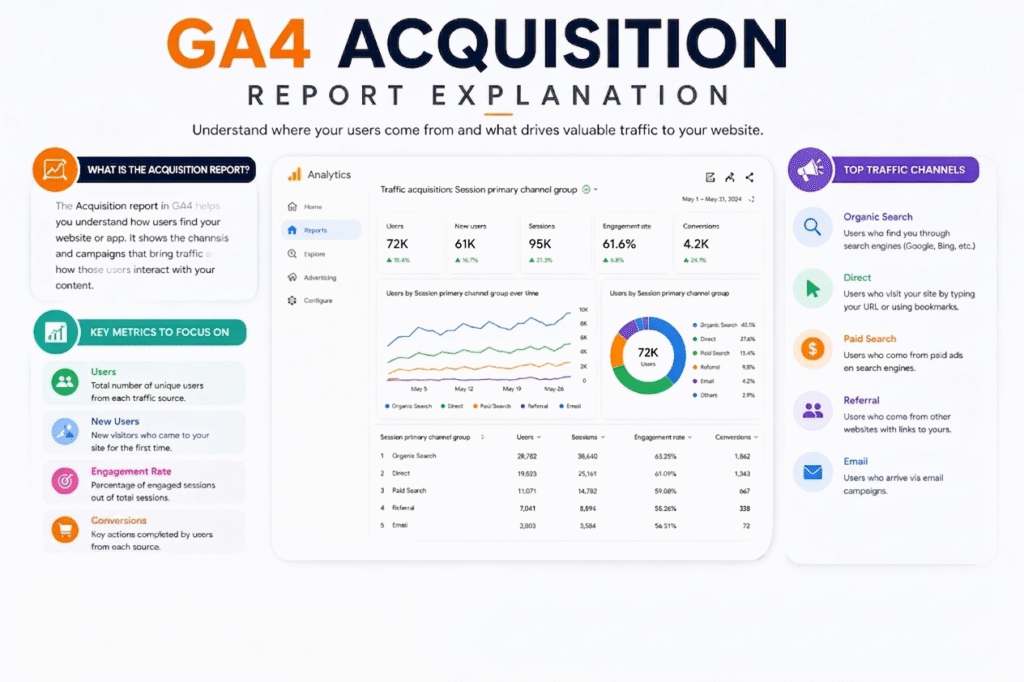
In this article, we will explain the GA4 acquisition report section in detail under the reports. The GA4 acquisition report section shows where your traffic comes from. You can see how you are acquiring your traffic in this section of the report.
But when you enter the GA4 acquisition report section, you can be confused. When you delve deeper into the section, you will discover a variety of acquisition methods.
- User Acquisition.
- Traffic Acquisition.
Here in the GA4 acquisition report section we start doubting these two sections. But don’t worry, these two are really interesting sections under the reports. Let’s start the detailing. But before starting the detailing, we should understand a few more small things to ensure everything is clear.
Session In GA4 acquisition report
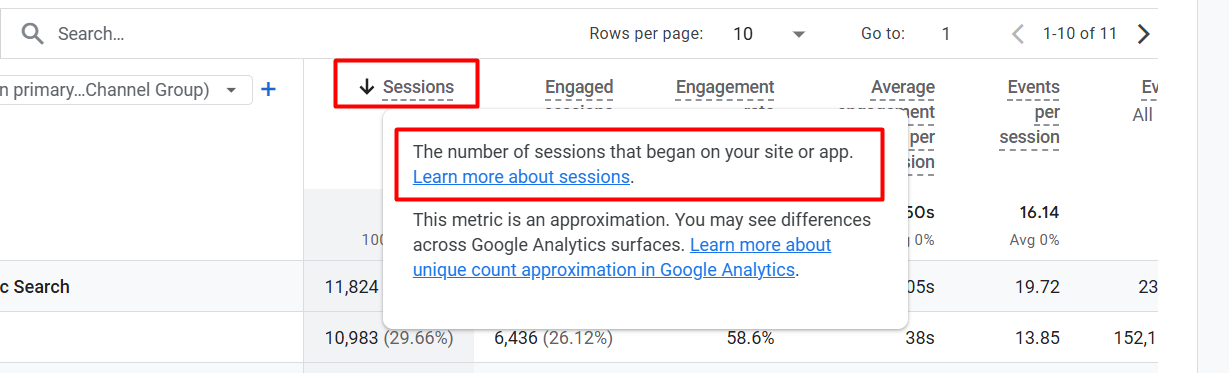
In a simple way, if I say ‘session’, it is the name of every single visit by your user. Every time your user visits your site or interacts with it, GA4 records it as a new session.
Example
A user visits your site through Google. Then your user visits three different pages on your site, completes some activities, and closes them. GA4 will record this total journey as a session.
Again, the same user came back to your site some time later, and then GA4 recorded one more new session for this visit.
So it’s really simple: every time, GA4 will record a new session whenever someone visits your website or your app. The session will stop or complete every time your user leaves your site or is inactive for the last 30 minutes.
That means if any user is on your site but inactive for the last 30 minutes and then they start activity again after 30, then again GA4 will count one more new session here; it doesn’t matter that your user was already there on your site.
In your reporting section, if the user count is 100 and the session count is 150, this indicates that those 100 users visited your site 150 times. This is the definition of session.
Engaged Sessions
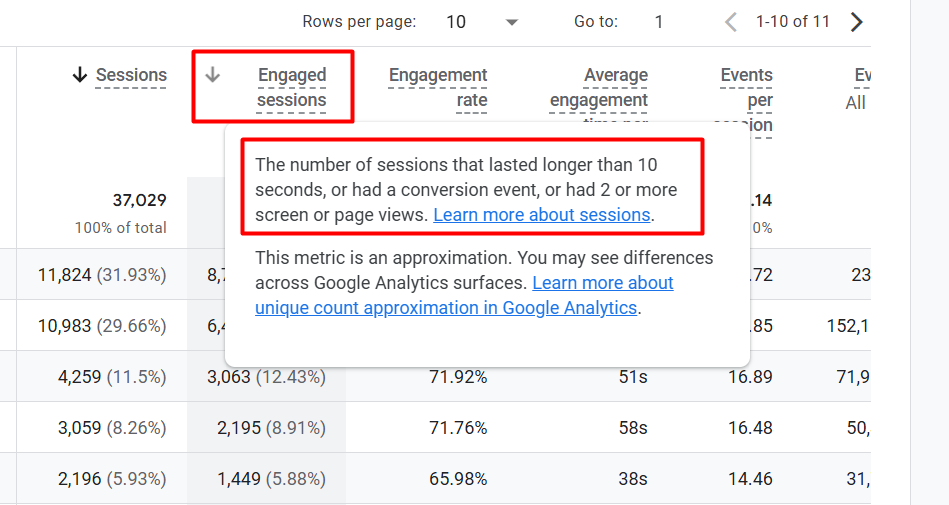
Engaged sessions are one of the important metrics in Google Analytics 4. Through this, we can measure what the amount of the engaged session is in the total session. GA4 will count a session as an engaged session if three things happen.
The first condition is that if a user stays on your site for at least 10 seconds after starting a session, completes any conversion, or visits at least 2 pages, GA4 will count the session as an engaged session.
Engagement Rate
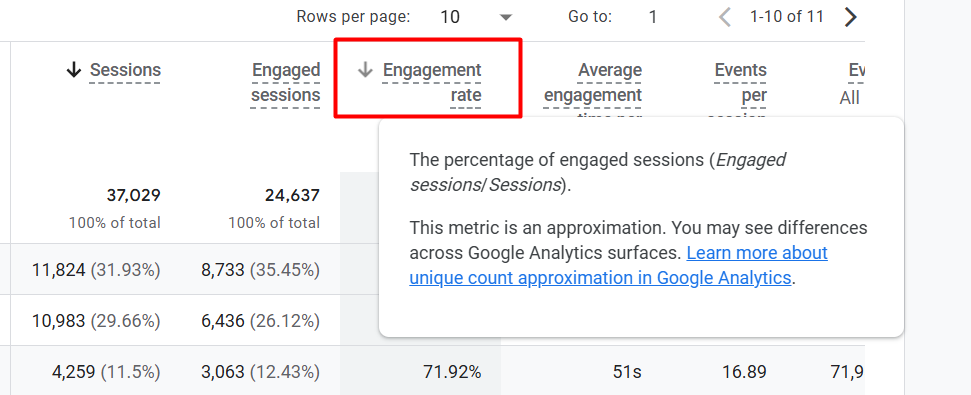
With these metrics we can measure the percentage of the engagement session from the total session done by your user.
With this formula, “Engagement Rate = (Engaged Sessions ÷ Total Sessions) × 100″, you can also measure the engagement rate.
Average Engagement Time Per Session
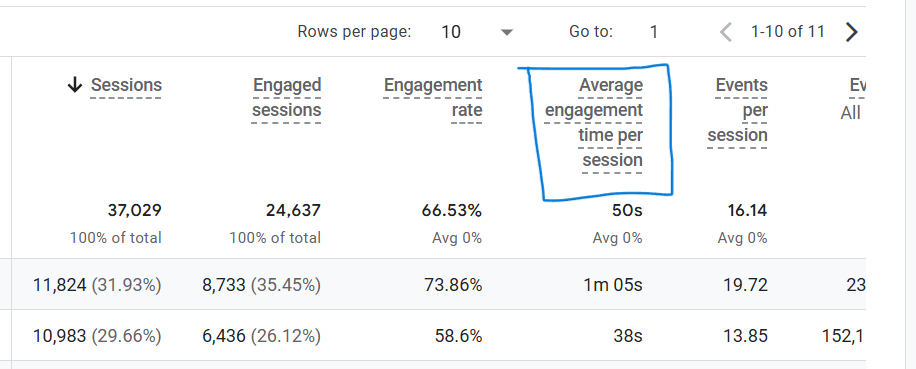
Through these metrics, you can learn about the average engagement time per session.
Some more Metrics
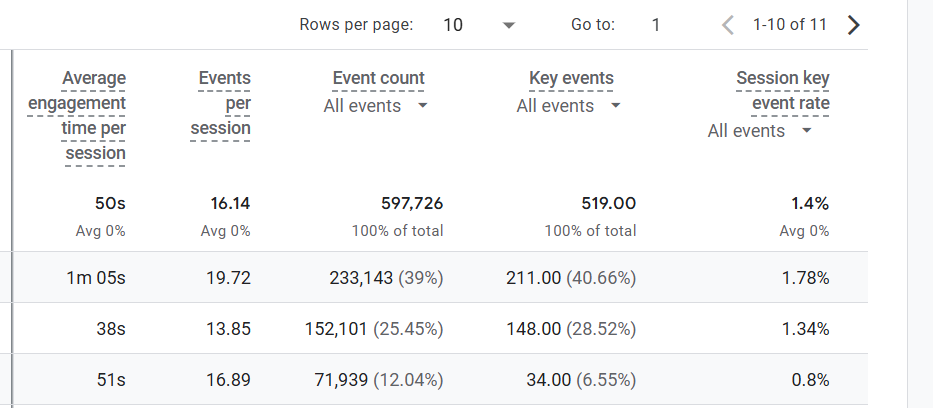
Events per session: Through these metrics, you can gain knowledge about the average event amount per session. To get the information, you have to divide your total event amount by the total session amount.
Event Count: This indicator shows the total number of events completed by your user through this particular source or medium.
Key events: This metric displays how many key events your user has finished using this specific source or medium.
Session key event rate: This metric displays the average percentage rate of the key event your user has finished using this specific source or medium.
Before completing the acquisition section, it was important to understand all of the metrics. This understanding will aid us in comprehending the report more effectively in the future. So let’s start the explanation of the total section in acquisition.
User Acquisition in GA4 acquisition report
We have already explained the acquisition report at the beginning of our article, where the acquisition section will help us learn about the sources of traffic to our site.
But here, through the user acquisition, we can learn how a user comes to our site for the first time.
Example
A user comes to us for the first time through Facebook, and then again, the same user comes to our site through Google. So according to the user acquisition, this user source will be Facebook.
In a simple way, if I explain to you, the user acquisition recorder records all of the users’ sources according to the first one they used to come to your site.
User Source in GA4 acquisition report
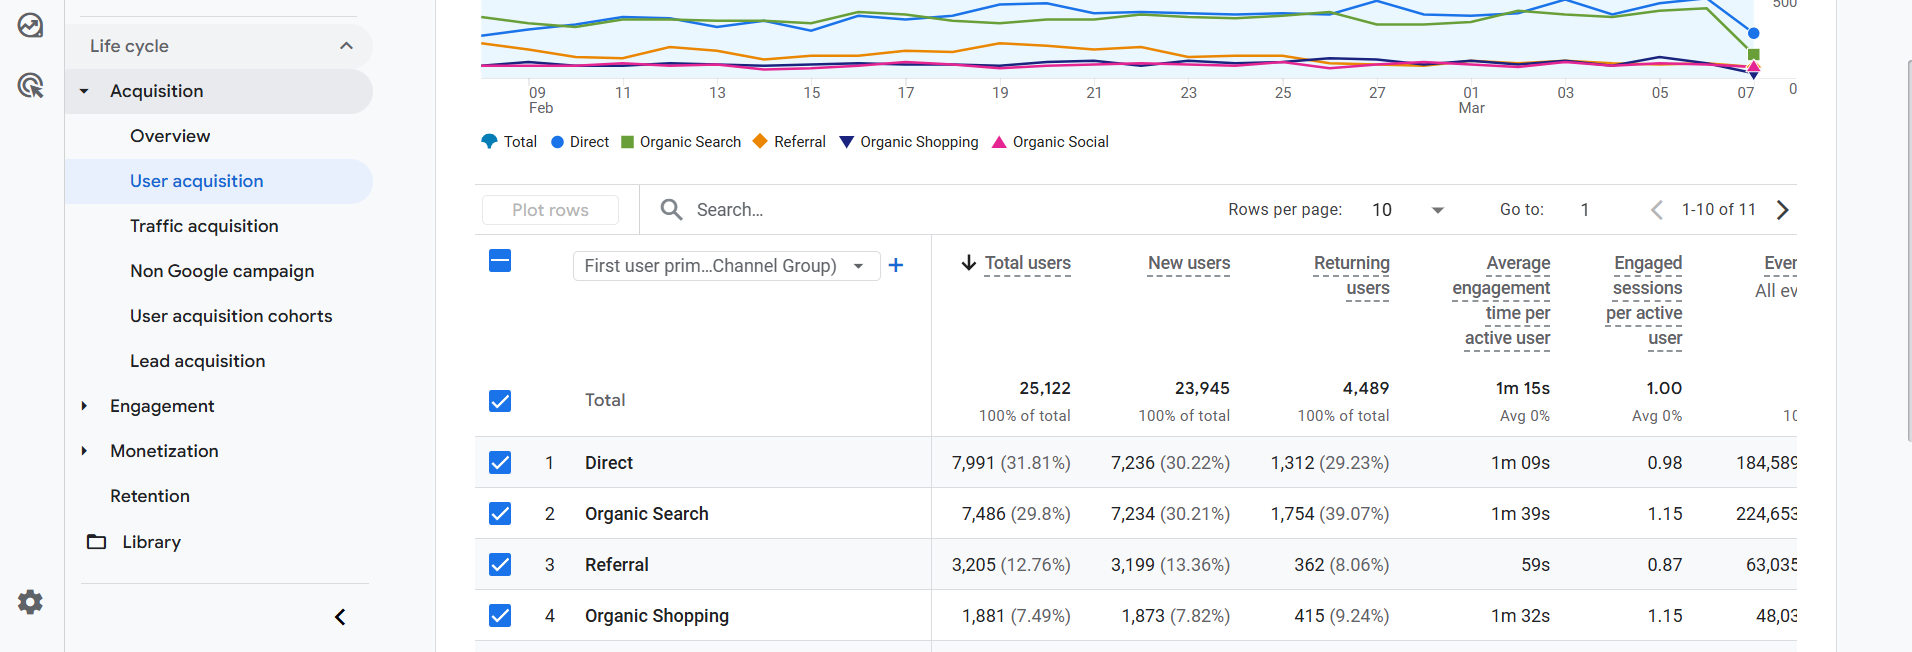
Here in the picture, you can see, through the organic search, how many users have come to your site in a certain period. Even if they return later through other channels, they will still be counted under organic search in the User Acquisition report.
In this line, you can also check the number of new users who visited this site for the first time during a specific period, as well as the number of returning users.
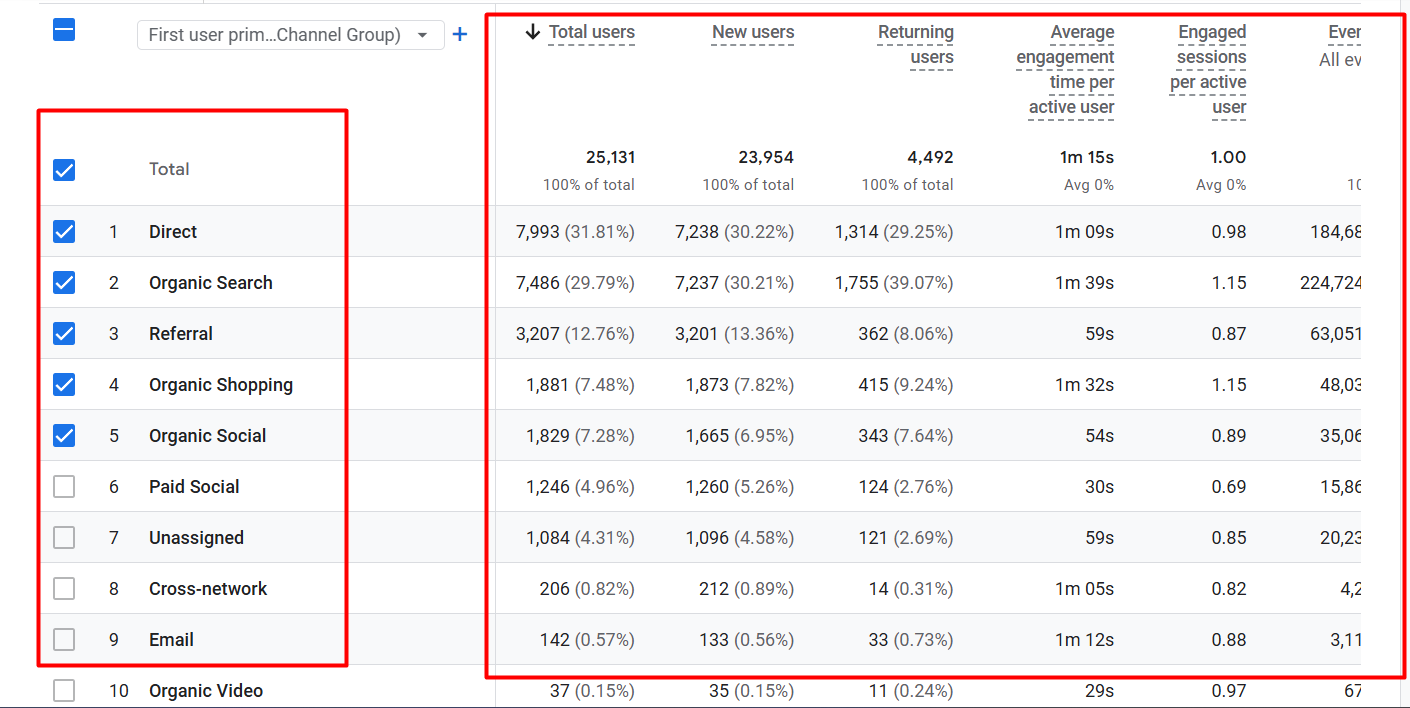
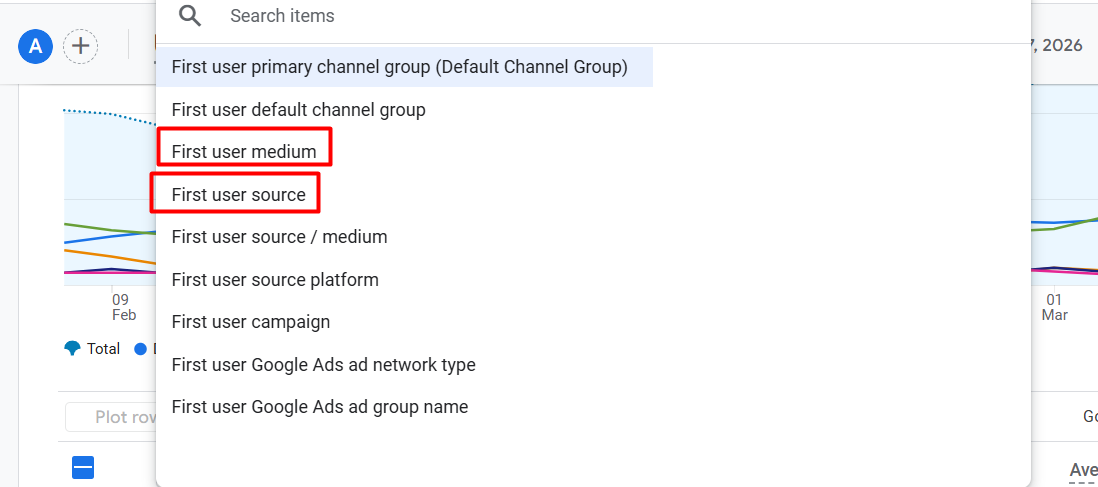
The image shows the source of the user and how many users come to your site for the first time. But here, do you know one more thing? User acquisition sources are usually described using two dimensions: source and medium.
The source shows where the user came from, such as Google, Facebook, or YouTube.
Medium shows the type of channel, such as organic, social, referral, or email.
Here in the report, you can see both together, but if you want, you can change them according to your needs.
Here you can see that GA4 (Google Analytics 4) provides a way to change it. If you are running Google Ads and select the Google Ads section, you can see the report.
Also, if you created UTM (Urchin Tracking Module) parameters for any campaign, then, according to the UTM source and medium, you can check the information here under user acquisition.
From this report, you can learn how many users have come to your site through your targeted source or medium, as well as the number of completed events, key events, and more.
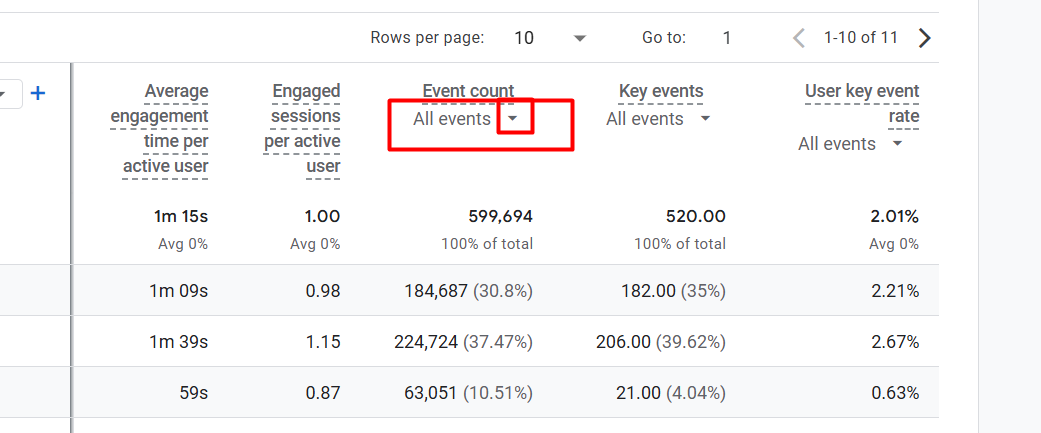
By clicking on the icon, you can select your targeted event to view the number of events completed by your user from the targeted source or medium.
Traffic Source in GA4 acquisition report
This one works according to every session or visit your user makes. This report shows you that every single session or visit happened from which source.
Example
One of your users came from Google and created one session, then the same person came back again from Facebook. As you can see, a single user created two sessions.
In the report, the source Google will count one session, and the source Facebook will count one session.
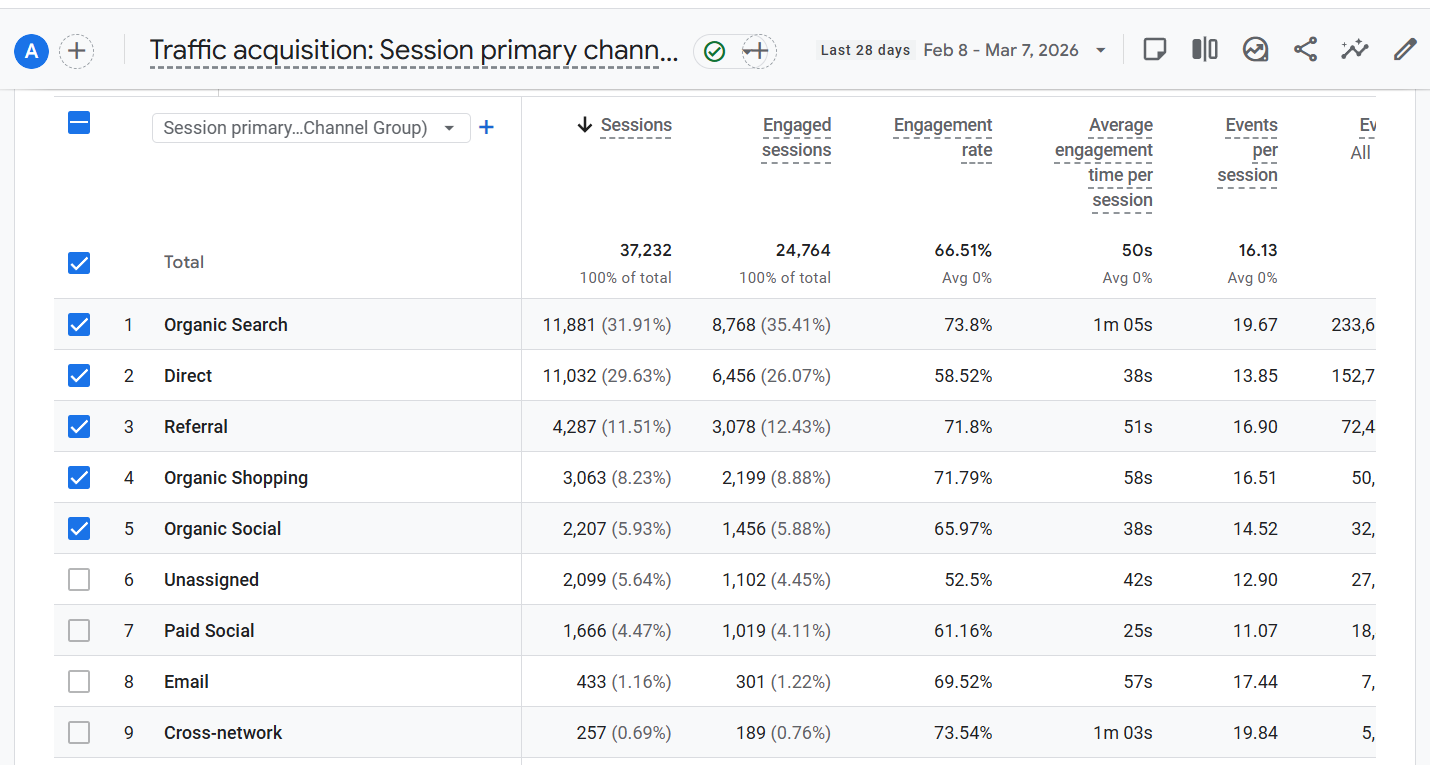
That means in this report, you can see from which source you are getting how many sessions or visits. Also, what is the number of engaged sessions, the rate, the average time, and many more things?
If your goal is to know which source brings the most new users to your website, you should check the User Acquisition report.
If your goal is to know which channel is bringing the most traffic or sessions, then you should check the Traffic Acquisition report.
User Acquisition Cohorts
This report shows which acquisition channels bring new users and how much revenue and transactions those users generate over time.
Lead Acquisition
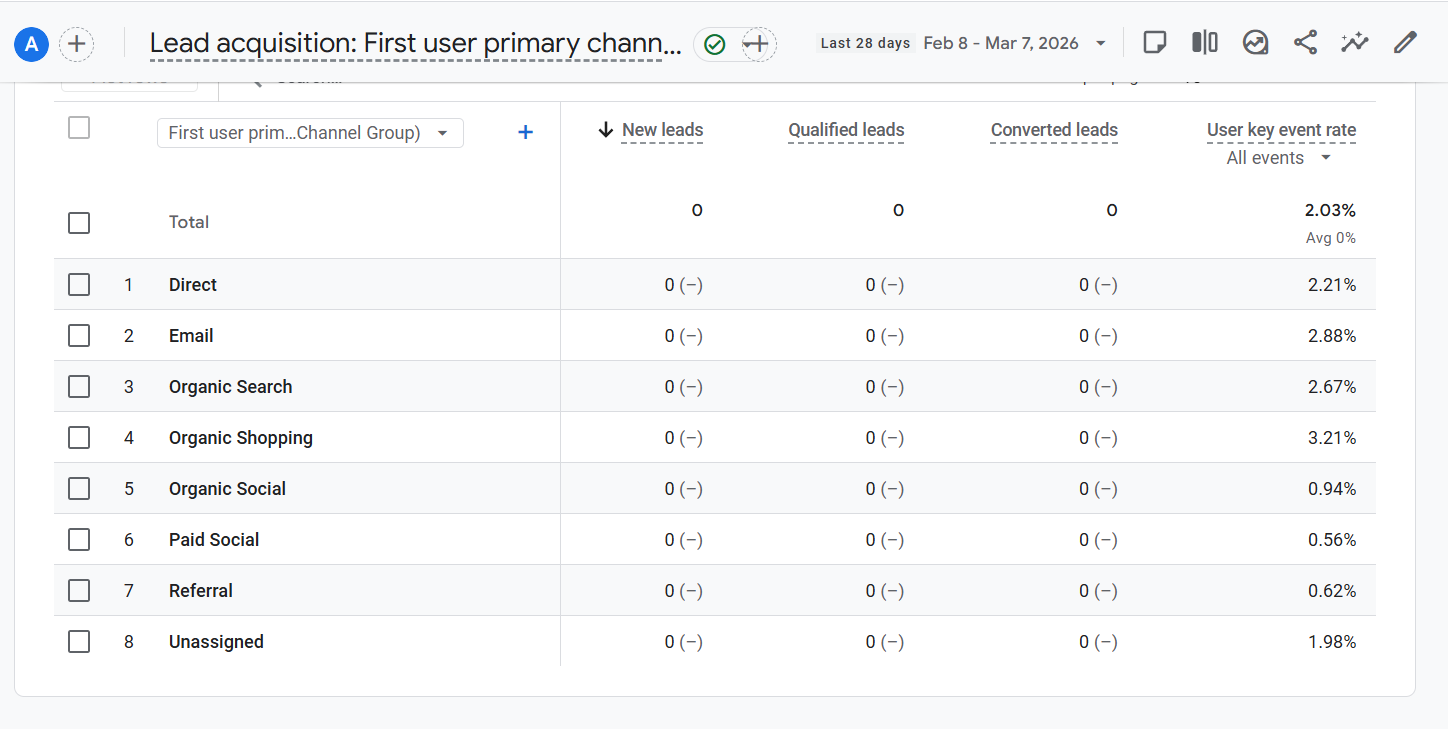
This report shows which acquisition channels bring leads and how many of those leads become qualified or converted over time.
Date Selection in GA4 acquisition report

In every section, you can change the date as per your target. On the header side, you will have the option to change the date for every single report sheet.
Great, our acquisition section explanation is now complete. We hope everything is now clear to you perfectly. But if you want to know anything else that you think we missed, you can contact us. We are always here to assist you.